
Alerts
Alerts
There are features and functions used in Arista NetVisor UNUM and Insight Analytics that are common throughout the user interface (UI). Please refer to the Common Functions section for more information on the use of these functions and features.
Selecting Alerts / Reports → Alerts displays the Alerts dashboard. The Alerts tab highlights.
The NetVisor UNUM Switch Analytics Alert module provides a method of creating Alerts notifying the user of monitored critical events.
Use the dashboard to set up the Alert Settings.
Usage Note: Please refer to the Supported Settings for NetVisor UNUM Alerts section for supported scenarios using NetVisor UNUM.
License Note: The NetVisor UNUM Alerts feature requires the UNUM-ALRT-LIC NetVisor UNUM add-on reporting license be installed. Please refer to the NetVisor UNUM License Management section. DEMO (demonstration) licenses enable NetVisor UNUM Alerts for a specific period of time.
Enter the applicable Time zone.
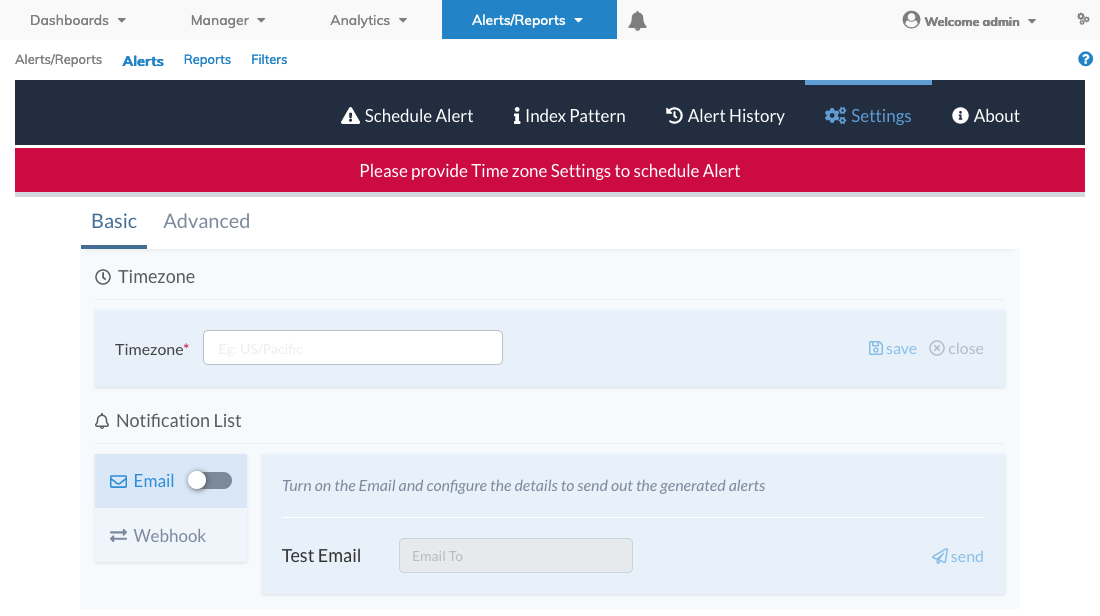
Alerts / Reports Alerts Setup
Click Save to continue. A confirmation message appears when the time zone is successfully set. The dashboard updates with the applicable timezone.
Use Edit to make further changes to the time zone.
Alerts / Reports Alerts Time Zone
Click Advanced to enter Proxy Settings, if required.
Options include: No Proxy, Manual Proxy or Use Automatic Proxy.
Follow the on-screen instructions for the option chosen and click Save to continue.
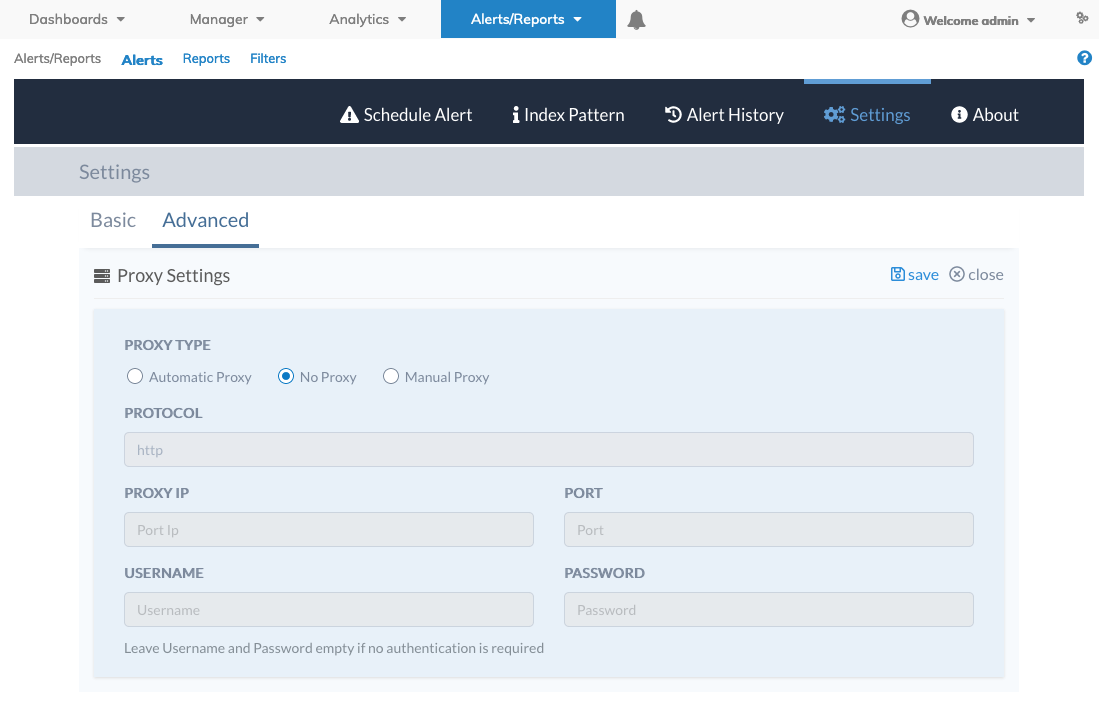
Alerts / Reports Alerts Proxy Settings
Notification Lists
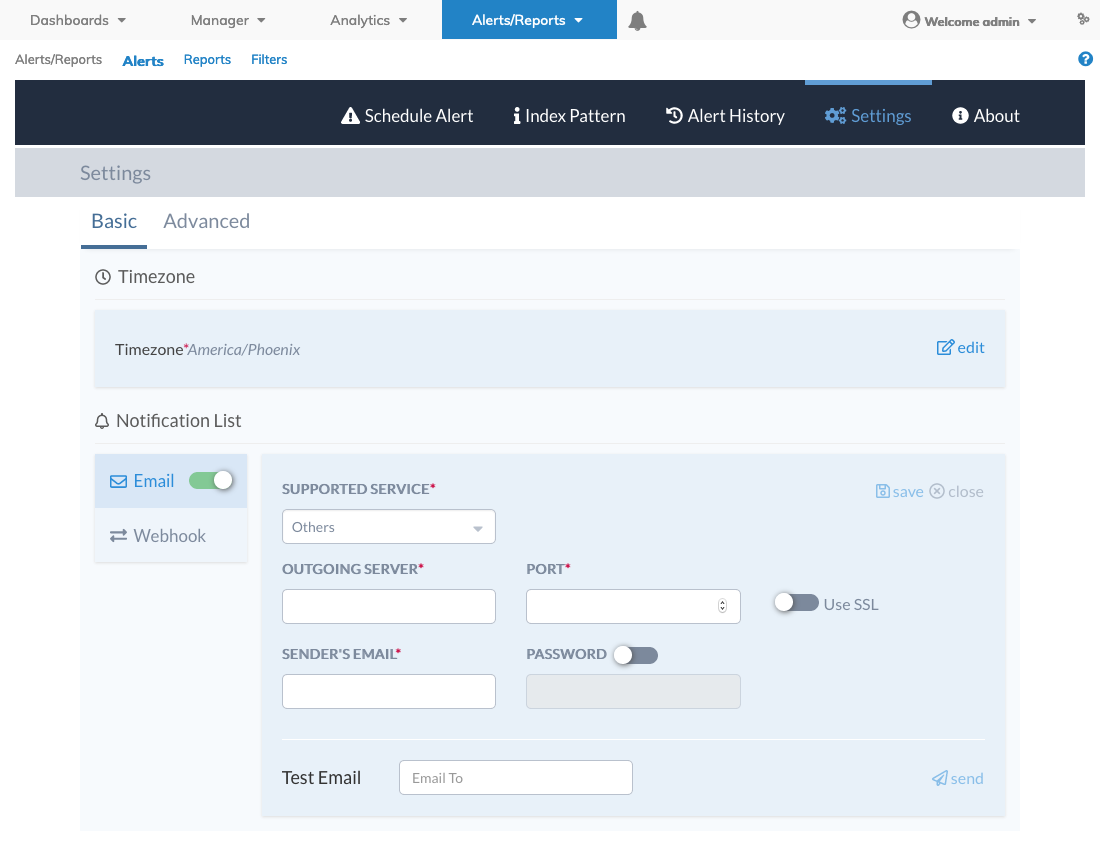
To enable Email, click the Email button. Enter the required settings.
Select Others to use your own email server or service provider or choose from Google Gmail or Amazon Simple Email Service (SES) providers.
Gmail users may wish to review these third-party supplementary configuration instructions.
In the case of an SMTP service provider server information is entered along with the service port and SSL encryption.
You must provide the senders email and check Enable Password when your email service provider requires it.
Alerts / Reports Alerts Email
Use the Test Email function to confirm the email service works.
A confirmation message appears when the email message is successfully sent.
If the settings are correct you should receive a test email message shortly.
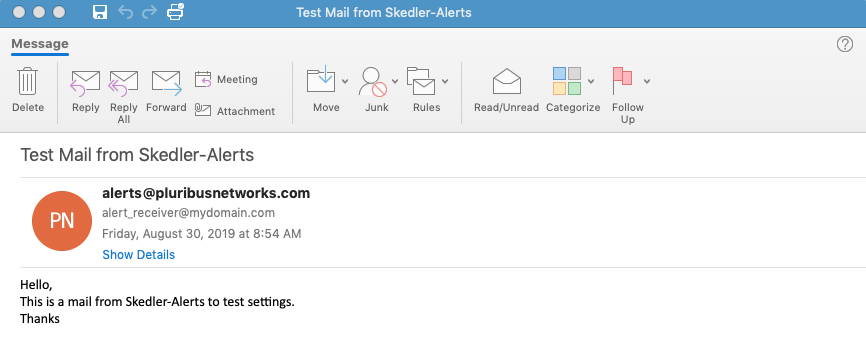
Alerts / Reports - Test Email Received
Index Pattern
Click Index to configure the Index Settings and Index Patterns for the Alert.
Before configuring Alerts, first enter the Index Patterns based on the type of data you require.
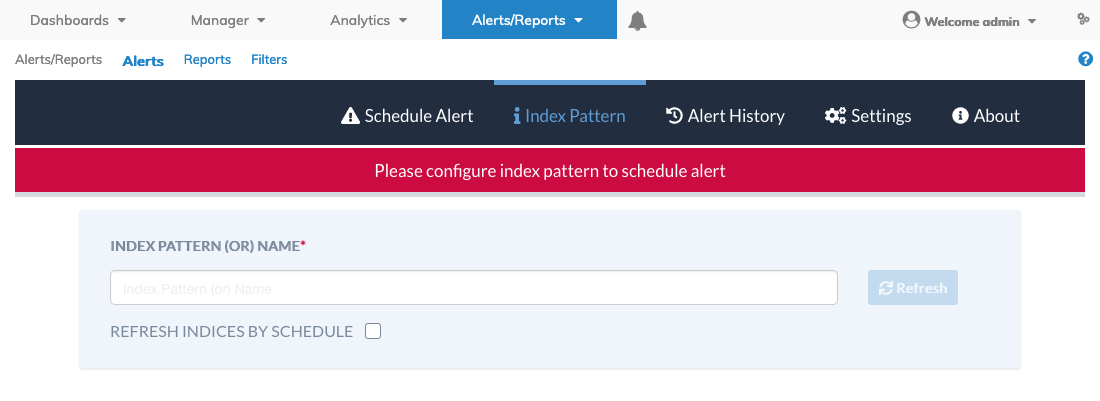
Alerts /Reports Alerts Index Settings
|
Index Patterns |
Notes |
|
all-audits |
Audit information for events such as, login, logout, licenses added, etc. |
|
all-connections |
Connections captured every 60 seconds. |
|
all-fabricresources |
Fabric dashboard information such as VLANS, Tunnels, VFR and VNI. |
|
all-hwutils |
Fabric dashboard, L2 / L3, Routes and vFlow switch information. |
|
all-meshpings |
Mesh ping information such as ping failures. |
|
all-portstatss |
Port information captured every 5 seconds. |
|
all-snmptraps |
SNMP traps captured by NetVisor UNUM - requires SNMP to be configured. |
|
all-syslogs |
Syslog events captured by NetVisor UNUM - requires Syslog to be configured. |
|
all-systemstatss |
CPU and memory information captured every 30 seconds. |
|
all-tunnelstatss |
Tunnel statistics captured every 5 seconds. |
|
all-vports |
vPorts details captured every 60 seconds. |
Alerts /Reports Alerts Index Pattern Types
If SNMP and/or SYSLOG are not configured in NetVisor UNUM, the all-syslog and all-snmptraps patterns will not be available.
Once entered, the Index Pattern is displayed in the dashboard.
Enter the Index patterns, such as “all-connections”. A confirmation message appears.
Note: You must first add the indices you want to monitor in Index Settings, then they will show up as a drop-down in the Index Pattern in the Alert Details.
The system will begin indexing the pattern and mapping data.
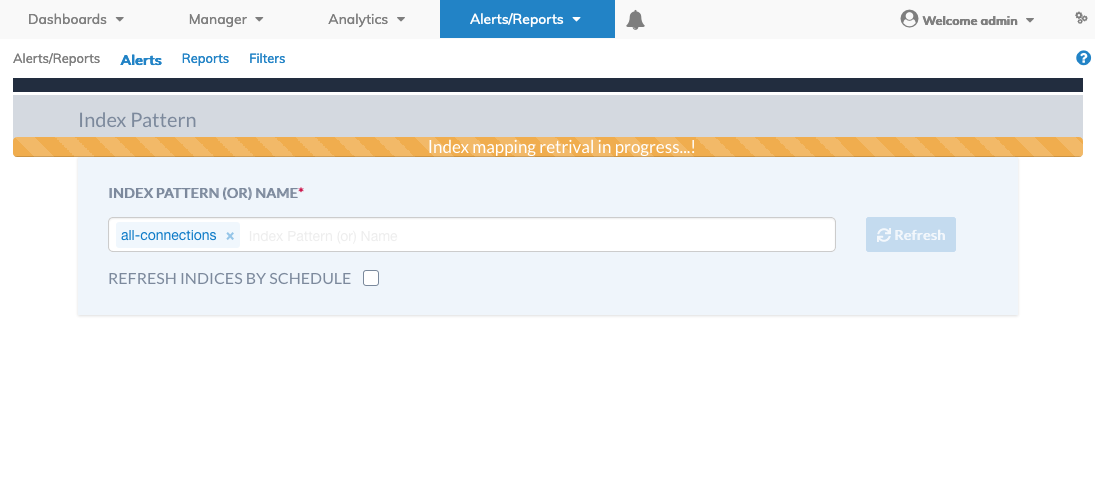
Alerts /Reports Alerts Index Pattern Mapping
The Index Pattern is displayed in the dashboard.
To setup a schedule to refresh the indices select REFRESH INDICES BY SCHEDULE and enter the applicable frequency schedule and click Schedule.
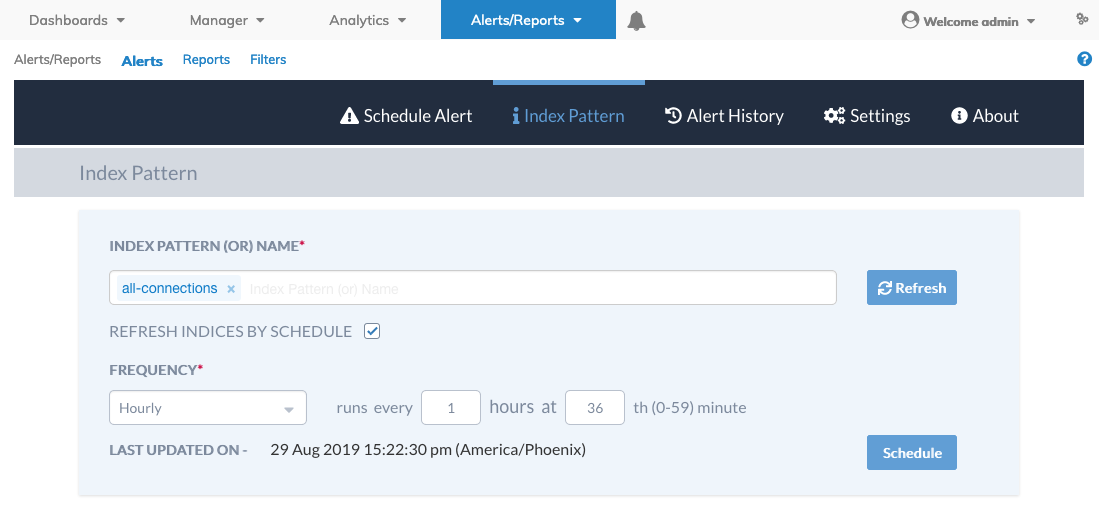
Alerts /Reports Alerts Refresh Indices by Schedule
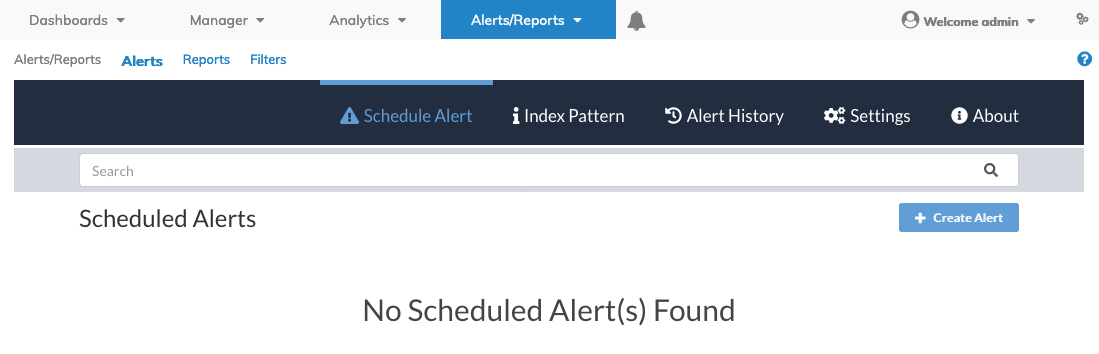
Create Alert
Once the Alerts configuration is complete you create an Alert by clicking, Schedule Alert.
Note: Before configuring Schedule Alert, first enter the Index Patterns based on the type of data you require under Index Pattern.
|
Index Patterns |
Notes |
|
all-audits |
Audit information for events such as, login, logout, licenses added, etc. |
|
all-connections |
Connections captured every 60 seconds. |
|
all-fabricresources |
Fabric dashboard information such as VLANS, Tunnels, VFR and VNI. |
|
all-hwutils |
Fabric dashboard, L2 / L3, Routes and vFlow switch information. |
|
all-meshpings |
Mesh ping information such as ping failures. |
|
all-portstatss |
Port information captured every 5 seconds. |
|
all-snmptraps |
SNMP traps captured by NetVisor UNUM - requires SNMP to be configured. |
|
all-syslogs |
Syslog events captured by NetVisor UNUM - requires Syslog to be configured. |
|
all-systemstatss |
CPU and memory information captured every 30 seconds. |
|
all-tunnelstatss |
Tunnel statistics captured every 5 seconds. |
|
all-vports |
vPorts details captured every 60 seconds. |
If SNMP and/or SYSLOG are not configured in NetVisor UNUM, the all-syslog and all-snmptraps patterns will not be available.
Information is captured periodically by the Collector.
Unless otherwise scheduled, polling occurs at 60 second intervals.
Alerts /Reports Alerts - Create Alert
Enter the Alert Details as required. Scroll down to display additional alert fields.
Note: Easily lookup all Indexes using “all-connections” and “all-portstatss” in the INDEX NAME field.
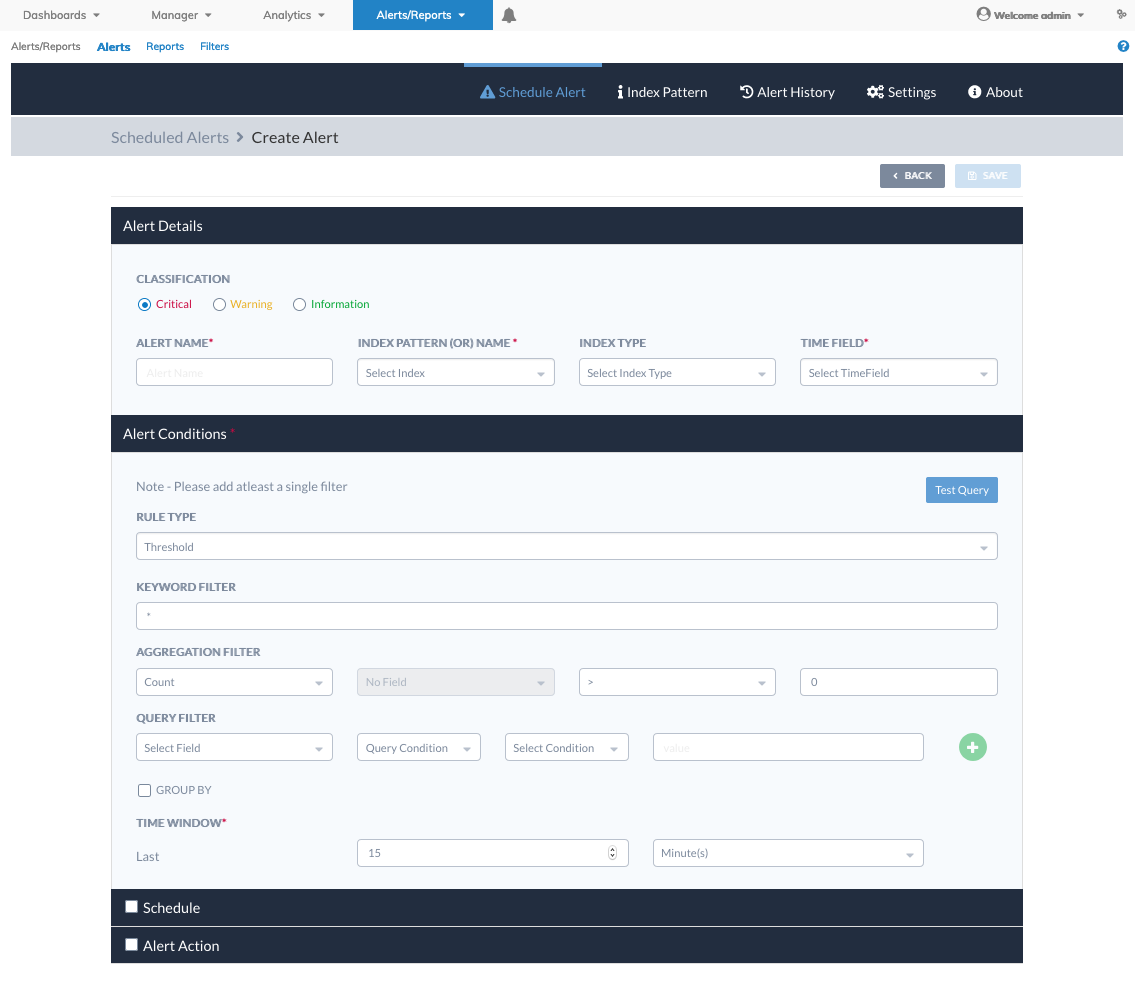
Alerts /Reports Alerts - Create Alert Parameters
Alert Rule Types
•Threshold – Match on any event matching a given filter
•Spike – Match when the rate of events increases or decreases
•New value – Match when a never before seen value appears in a field
• Repeated value – Match when a repeated value appears in a field
•Flatline – when event threshold attains dead state i.e threshold < 1
Use Test Query to test the alert. The output reveals the Query and the Response.
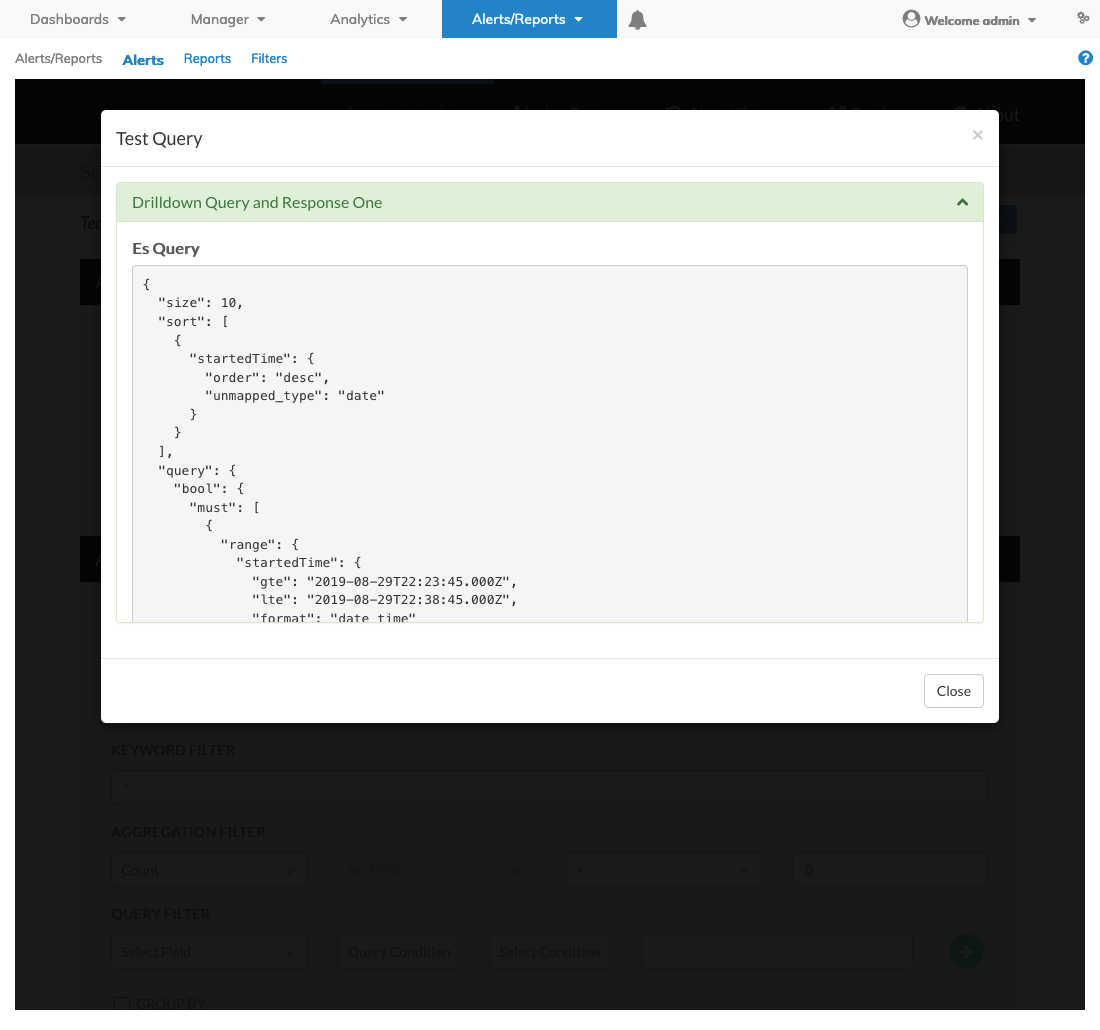
Alerts /Reports Alerts - Test Query Output
Click Close to return to the previous screen.
Complete the Alert Conditions sections: Rule Type, Keyword Filter (as appropriate) Aggregation Filter, Query Filter and Group By ( as needed).
You must add at least one filter. The ![]() + icon remains inactive until an Alert Conditions filter is complete.
+ icon remains inactive until an Alert Conditions filter is complete.
Once a filter is complete, click the active ![]() + icon to create the filter condition.
+ icon to create the filter condition.
A red ![]() - icon appears which you use to delete the filter if it is no longer required.
- icon appears which you use to delete the filter if it is no longer required.
Repeat the process of adding filters, as required.
When complete, scroll to the end of the configuration window and click Schedule and Alert Action enter Schedule frequency (required parameter) and complete the required Alert Action.
Customize the alert message field as required.
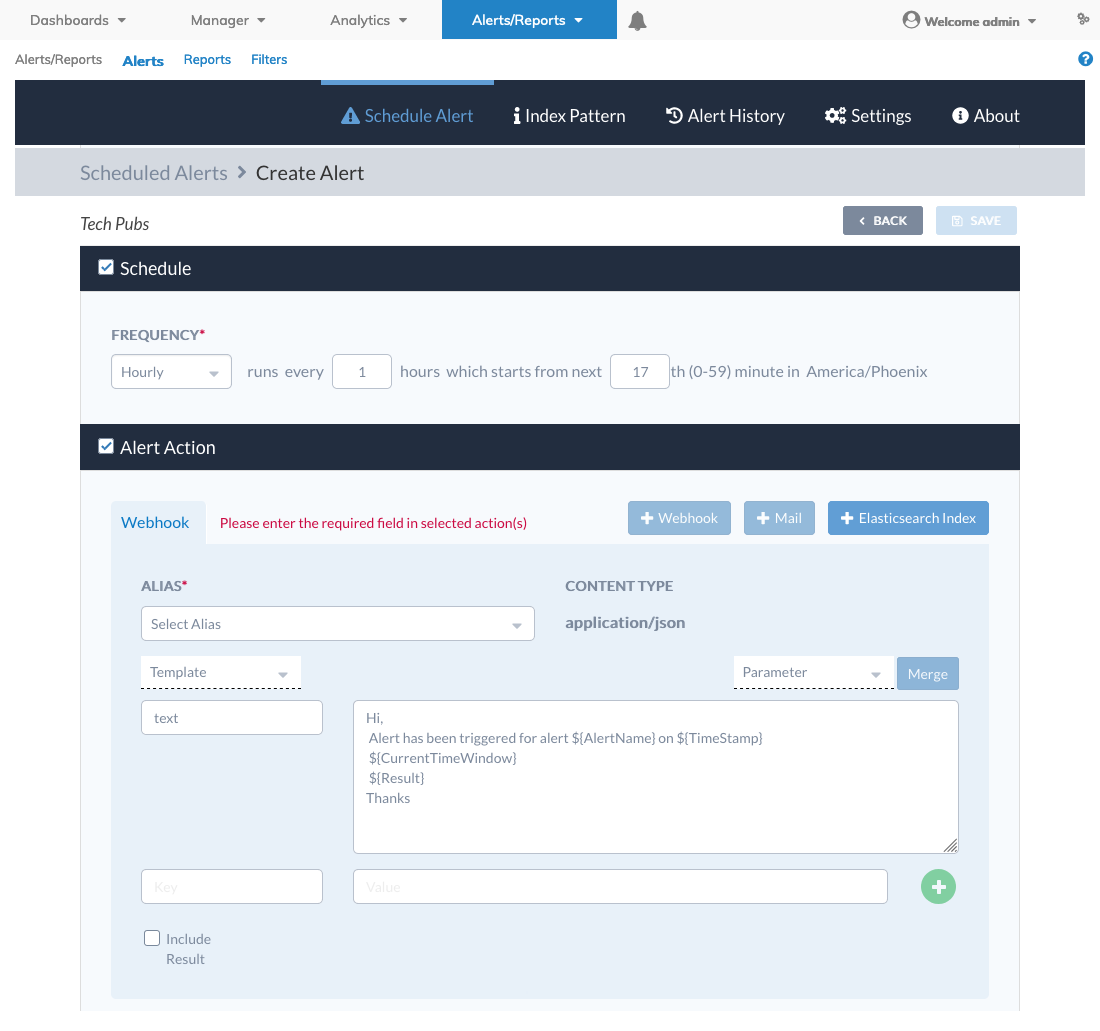
Alerts /Reports Alerts Notification Settings
Click Save to save the Alert or Back to return to the previous screen without saving.
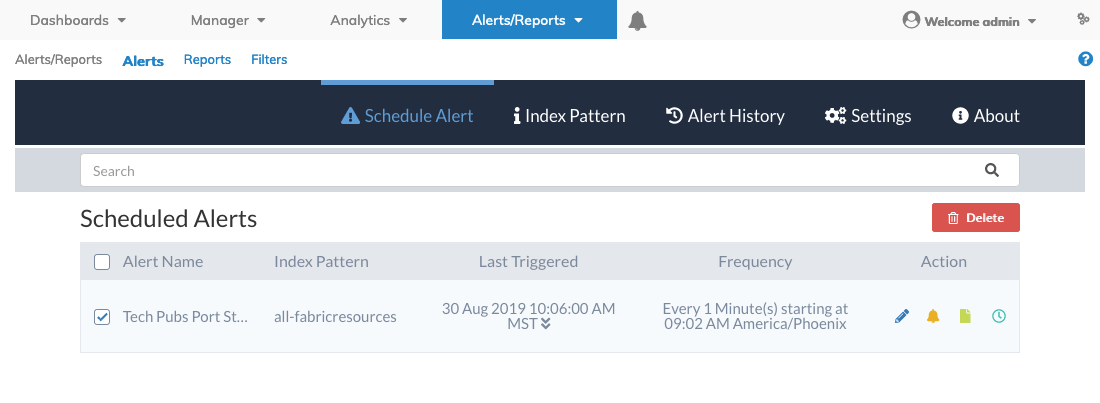
The Alert is then displayed on the Alerts dashboard.
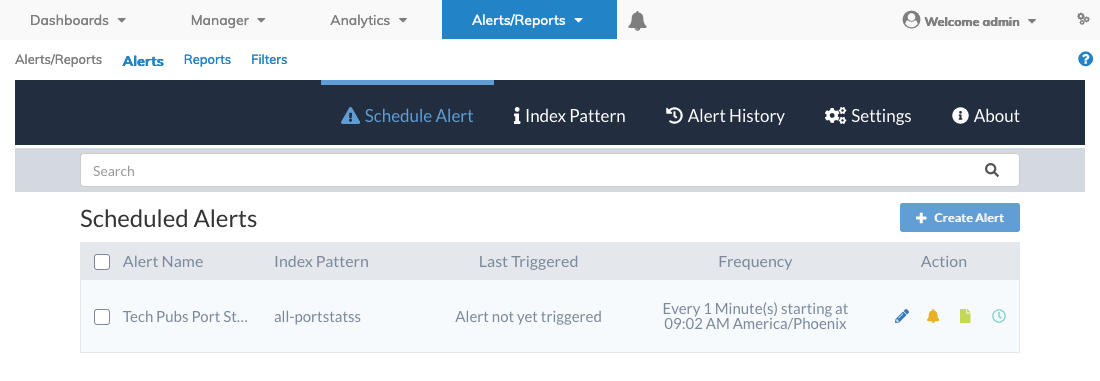
Switch Analytics Alert Module Dashboard
Alerts Details, Alert Conditions, Schedule Details and Alert Action parameters can all be adjusted depending on the monitoring and alerting requirements.
You make further changes to the Alert selecting the Edit, Snooze, Clone or the Alert History icon under Action.
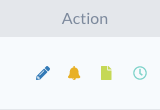
Switch Analytics Alerts Action Function
Alert History
You review alert history by clicking on the Alert History link.
Time range drill-down selections are Quick, Relative and Absolute. Time Window and No. of Documents provide more granular information.
Enter the applicable Time Range and click GO to continue.
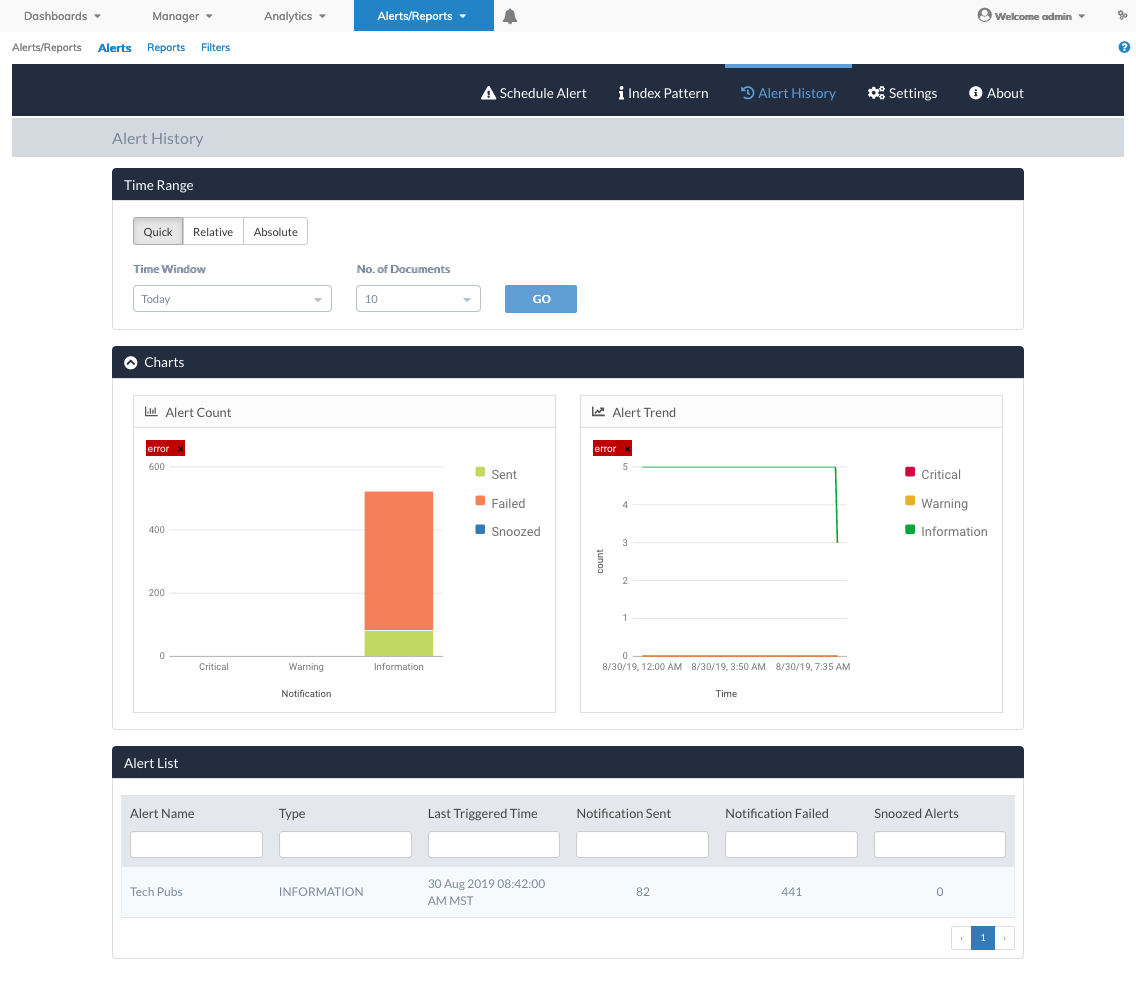
Alerts /Reports Alerts History
Alert Email - Example
The following is an example of an alert email message.
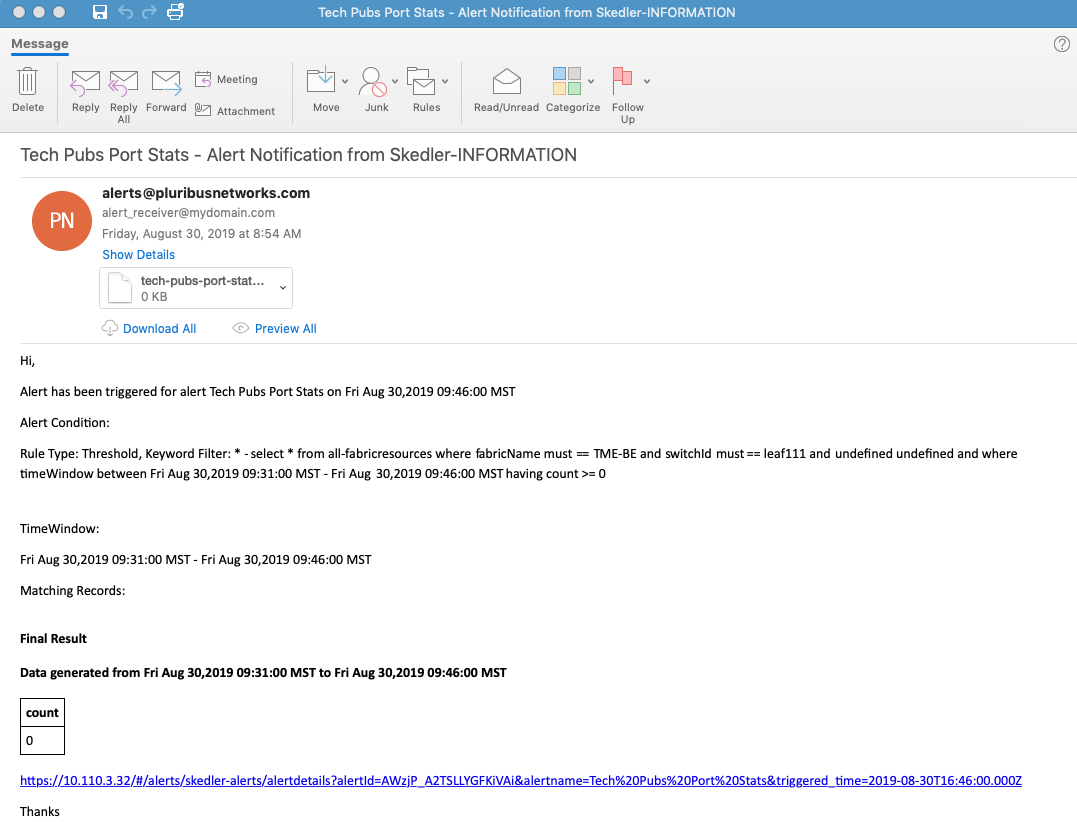
Alerts /Reports Alerts Email Example
When an alert email is generated, the body of the message contains a clickable link. The link takes you to the dashboard containing the alert data.
For example:
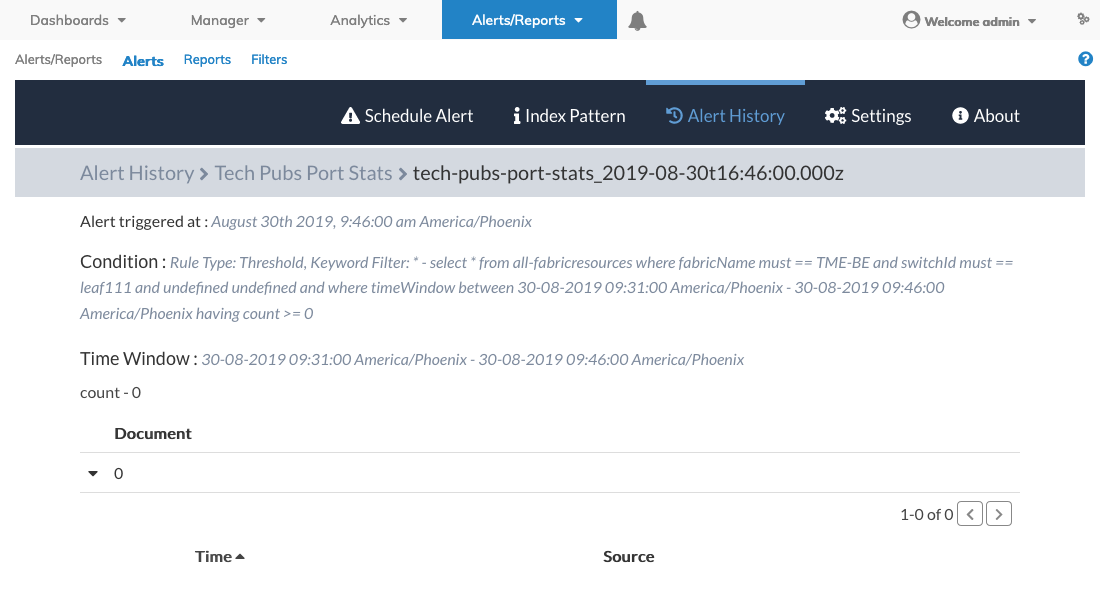
Alerts /Reports Alerts Clickable Link
To delete an Alert, select the rule to be deleted and click Delete.
Alerts /Reports Alerts Delete