About sFlow
As businesses rely on network services for mission critical applications, small changes in network usage can impact network performance and reliability. These changes can impact a business’ ability to conduct important business functions, which can increase the cost of maintaining network services.
sFlow (also known as 'sampled flow'), is an industry standard monitoring feature that provides visibility into network usage and active routes on the network. The sFlow feature provides the data required to effectively control and manage network usage and supports application-level traffic flows at wire-speed on all physical interfaces. This capability ensures that network services provide a competitive edge to the businesses.
In Netvisor ONE, the sFlow monitoring system has two main components: the sFlow collector and sFlow agent. The sFlow agent runs on Pluribus switches for sampling of packets and are sent to the sFlow collector for further processing, see Figure 13-1 below.
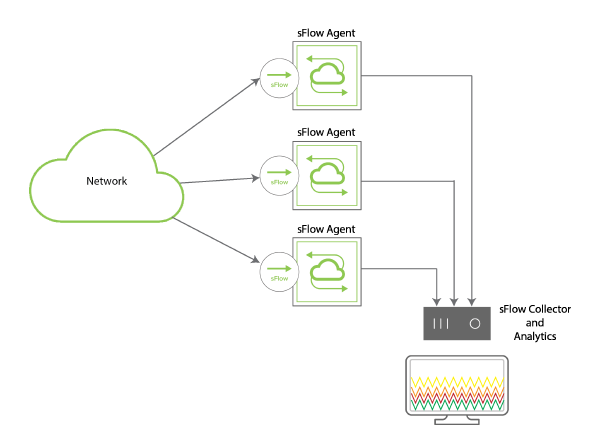
Figure 13-1 - Sample Topology of sFlow Monitoring System
The sFlow monitoring system supports two types of samplers: (i) Ingress sFlow sampler and (ii) Egress sFlow sampler. You can configure both or one of the sampler types on a port in Pluribus switches to enable sampling of IN and OUT packets simultaneously. That is, the Pluribus switches support sFlow at port level, allowing you to configure the sample threshold rates using the Netvisor ONE CLI commands.
A few examples of sFlow applications include the following:
- Detecting, diagnosing, and fixing network problems
- Real-time congestion management
- Understanding application mixes such as HTTP, Web, DNS
- Accounting usage for billing
- Audit trail analysis to identify unauthorized network activity and trace sources of Denial of Service (DoS) attacks
- Route profiling and optimizing peers
- Trending and capacity planning
sFlow is an open source sampling tool providing constant traffic flow information on all enabled interfaces simultaneously. sFlow data is sent to a collector that formats the data into charts and graphs while recording and identifying trends on the network. You can use this information for troubleshooting a network, performing diagnostics, and analyzing the data.
Packet Sampling
Packet sampling is used to characterize the network traffic. If the sFlow agent on the switch is configured for packet sampling, the agent takes copies of random samples of forwarded packets within the CPU and forwards the headers and some of the payload data of the sample packet to the sFlow collector at regular intervals. You can specify the number of packets to sample from the total packets and this is called the sample rate. On an average, one in every N packets is captured and analyzed. Random sampling prevents the synchronization of periodic traffic patterns.
The packets are stored and sent to the sFlow collector at an interval that you can configure on the switch. This is called the polling interval. You can apply sampling to ingress and egress frames independently. The rate at which the sFlow agent sends datagram depends on the sampling rate, the traffic rate, and the configured maximum datagram size.
You can sample different types of packets such as frames sent to the CPU or interfaces of the switch, routed packets, flooded packets, and multicast packets.
However, the following packet types are not sampled by sFlow:
- LACP frames
- LLDP frames
- STP RPDUs
- IGMP packets
- Ethernet PAUSE frames
- Frames with CRC errors
- PIM_HELLO packets
- Packets dropped by ACLs/vFlows
- Packets dropped as a result of VLAN violations
- Routed packets with IP options or MTU violations
To enable sFlow on your switch, you must configure the following (described in subsequent sections):
- sFlow Collector
- Add Exporter license (see UNUM documentation for details on adding the license)
- sFlow Agent