Using Wireshark to Analyze Packets in Real Time
To use Wireshark to interactively analyze packets in real time, you need to capture a packet traffic flow, either on a specific switch or across the entire fabric using the scope option. Include the log-packets option to send packets to the associated pcap files, for example:
CLI (network-admin@Leaf1) > vflow-snoop scope fabric src-ip 112.168.3.105 action copy-to-cpu log-packets
Next, create a fifo on the host running Wireshark.
mkfifo /tmp/pcap
Start Wireshark, and select Options from the Capture menu.
Enter the fifo path that you created in the Interface field: /tmp/pcap
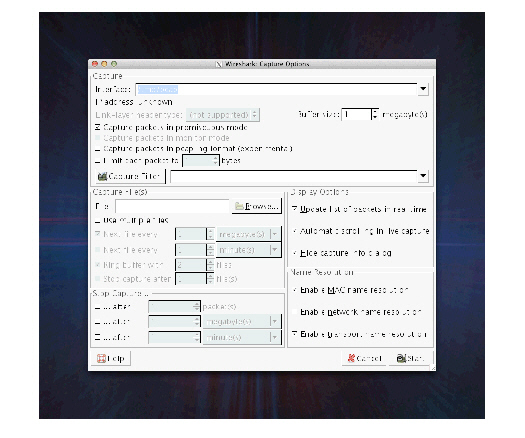
Figure 12-8 - Wireshark Interface
Wireshark Capture Options
Use tail to copy the pcap file to the FIFO:
tail +0f \
/net/ServerSw_Name//global/flow/Flow_Name/switch/Switch_Name/pcap/tmp/pcap
You need to substitute ServerSw_Name, Flow_Name and Switch_Name to match your environment.
Live capture continues until the packet capture file is rotated. By default, the maximum packet capture file size is 10MB but it is configurable with the packet-log-max option of the vflow-create and vflow-modify commands.
Note: The mkfifo command used in this task is a standard feature of Linux-like operating systems, including MacOS. For Windows platforms, you may need to install the GNU CoreUtils package available at http://gnuwin32.sourceforge.net/packages/coreutils.htm.