About sFlow
As businesses rely on network services for mission critical applications, small changes in network usage can impact network performance and reliability. These changes can impact a business’ ability to conduct important business functions, which can increase the cost of maintaining network services.
sFlow is a technology for monitoring traffic in data networks as defined by the Internet Engineering Task Force (IETF) in RFC 3176 and later superseded by version 5 in sflow_version_5.
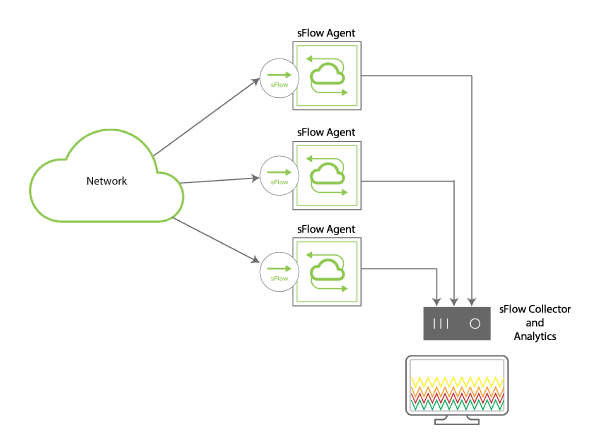
The sFlow monitoring system consists of an sFlow Agent, embedded in a switch or a router, and a central sFlow Collector. The architecture and sampling techniques used in the sFlow monitoring system allows continuous monitoring of high speed traffic in data networks.
The sFlow system provides the data required to effectively control and manage network usage and supports application-level traffic flows at wire-speed on all physical interfaces. You can use this information for troubleshooting a network, performing diagnostics, and analyzing the data. This capability ensures that network services provide a competitive edge to the businesses.
In Netvisor ONE, the sFlow monitoring system has two main components: the sFlow Collector and sFlow Agent. As displayed in Figure 15-1, the sFlow Agent runs on Pluribus switches, samples the packets, and sends the packets to the sFlow Collector for further processing.
sFlow Collector: An sFlow Collector is a network device that receives sFlow packets from one or more sFlow Agents.
sFlow Agent: The sFlow Agent is a thread that runs on Pluribus switches and receives the sFlow packets from the hardware, modifies by adding the header and sends the packets to the sFlow Collector.

Figure 15-1 - Sample Topology of sFlow Monitoring System
Packet Flow Sampling: Packet Flow Sampling refers to the statistical selection of a fraction of the Packet Flows observed at a Data Source. If the sFlow Agent is configured on Pluribus switches, then, Netvisor ONE performs two sampling mechanisms:
- Sample Rate mechanism - the packets are first sampled by the hardware and is passed onto the software where the sFlow thread adds sample header and sends the same to the Collector. You can configure the number of packets to sample from the total packets using the CLI option, sample-rate.
- Counter Polling mechanism - you can configure a timer using the CLI option, counter-polling-interval. On expiry of the timer, Netvisor ONE collects the statistics from the hardware and construct a sample with sFlow header and then sends the same to the Collector via the UDP socket.
You can sample different types of packets such as:
- Frames sent to the CPU or interfaces of the switch
- IP Options and MTU violations
- Flooded packets
- Multicast packets
However, the following packet types are not sampled by sFlow:
- LACP frames
- PAUSE frames
- PIM hello packets
- CRC error frames
- Packets dropped by ACLs or due to VLAN violations
- the sFlow port is invalid
- the sFlow Agent fails to match the sample port
- there is a network connectivity issue
- the sFlow packets are malformed or are IPv6 packets
- there are malformed VLAN packets or oversized packets
- there are internal Queue drops
To enable sFlow on your switch, you must configure the following (described in subsequent sections):
- Configuring the sFlow Collector
- Add Exporter license (see the sFlow sections in the Pluribus Installation and User Guide for details on adding the license)
- Configuring sFlow Agents on the Network
