
About sFlow
sFlow (short for “sampled flow”) is a popular networking technology supported by various networking vendors to monitor data traffic exchanged by switches and routers. It was first defined in Internet Engineering Task Force (IETF)’s Informational RFC 3176 and was later updated to sFlow version 5 based on a common specification maintained by the sFlow.org group.
An sFlow monitoring system consists of an sFlow Agent (embedded in a switch or router) and of a central sFlow Collector. An sFlow Agent uses traffic sampling techniques to capture traffic statistics from the device it is monitoring and to achieve scalability in high-speed networks (Gbps speeds and higher). sFlow datagrams are used to convey the sampled traffic statistics to an sFlow Collector for analysis.
A central Collector can aggregate the information exported from thousands of agents, which makes it suitable to provide continuous data center-wide (and even multi-site) traffic visibility into high-speed switched and routed networks.
An sFlow monitoring system enables administrators to obtain the statistics required to effectively control and manage network usage. It supports visibility into application-level traffic flows on all physical interfaces. You can use this information to troubleshoot a network, to perform diagnostics, and to analyze traffic patterns and network efficiency. Hence, you can use the sFlow functionality to ensure that network services match or exceed the requirements set forth by businesses.
About sFlow in NetVisor OS
As defined by the sFlow Version 5 reference document, NetVisor OS supports sFlow’s two main embedded components: a native Agent with packet sampling and the export function to the Collector(s).
As displayed in Figure 16-1, the sFlow Agent runs on NetVisor OS switches, extracts data plane traffic using hardware-assisted sampling, and sends the sampled packets using a special format to the sFlow Collector for further processing.
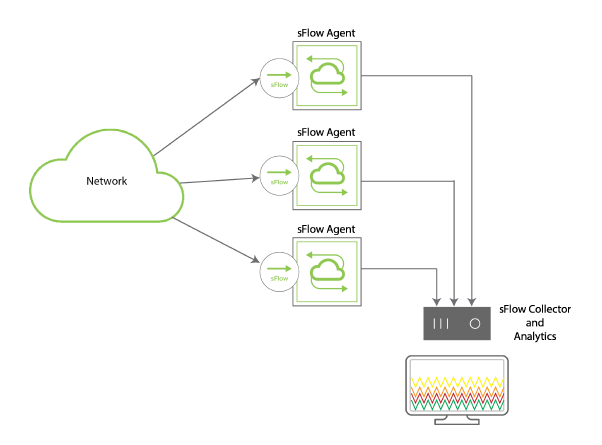
Figure 16-1 - Network Topology with Switch-based sFlow Agents and Collector Device
Packet Sampling: Packet sampling refers to the random selection of a fraction of the packets observed by the switch where the Agent is running. Since sampled packets correspond to various traffic flows, this function randomly samples traffic flows: hence, it is also referred to as packet flow sampling.
If the Agent is enabled, NetVisor OS provides two configuration options for the sampling function:
- Sampling Rate: The sampling rate specifies the ratio of the packets observed by the hardware to the samples generated. For example, a sampling rate of 100 specifies that, on average, 1 sample will be generated for every 100 packets observed. The packets are sampled by the hardware and passed to the software which adds the sFlow encapsulation header and sends them to the Collector. You can configure the sampling rate using the sample-rate command option.
- Counter Polling Interval: The counter polling interval is the maximum number of seconds between successive samples of the counters associated with the data source. You can configure it using the counter-polling-interval command option. On expiry of the timer, NetVisor OS collects the traffic statistics from the hardware and constructs an sFlow datagram to send to the Collector. The Counter Polling process results in the generation of Counter Records. When available, the sFlow Agent collects both Counter Records and Packet Flow Records and exports them within sFlow datagrams.
The sFlow can sample different types of frames such as:
- Frames sent to the control plane (CPU)
- Frames forwarded through switch interfaces
- Packets using IP options
- Frames resulting in MTU violations
- Flooded packets
- Multicast packets
However, the following types of frames cannot be sampled by sFlow
- Control plane frames such as LLDP/LACP/STP PDUs
- PAUSE frames
- PIM hello packets
- CRC errored frames
- Packets dropped by ACLs
- Packets dropped due to VLAN violations (i.e., received with unconfigured VLANs on a port)
NetVisor OS switches support sFlow at the port level with two types of samplers:
- Ingress sFlow sampler
- Egress sFlow sampler
You can configure either sampler type, or both at the same time, to implement unidirectional or bidirectional packet sampling.
sFlow datagrams are sent to an sFlow Collector using the UDP protocol. The official UDP port number for sFlow is 6343. Each datagram provides information about the sFlow version, the originating device’s IP address, a sequence number, the number of samples it contains and one or more flow and/or counter samples.
If the configured sFlow Collector is unreachable due to any connectivity issue, the sFlow Agent tries to resend the sFlow datagrams every 60 seconds. During this time , the datagrams are recorded as sFlow drop packets.
The sFlow datagrams could get dropped when:
- The sFlow port is invalid
- The sFlow Agent fails to match the sample port
- There is a network connectivity issue
- The sFlow datagrams are malformed or oversized
- The sFlow datagrams use IPv6
- There is traffic congestion with queue drops
You can use the sflow-show command to display the datagram drop counts.
To enable sFlow on a switch, you should configure the following functions (as described later in this document) in this order:
- Configuring the Export Function to the sFlow Collector
- Configuring the sFlow Agents in the Network