
Fabric Health
Fabric Health
The UNUM platform continuously monitors multi-vendor networked elements across the Fabric to collect extensive physical link layer and device-level data providing an accurate real-time picture of network and device health.
Real-time alerts notify operators when Key Performance Indicators (KPIs) cross defined thresholds to identify emerging anomalies proactively.
Advanced diagnostics and event-driven insights enable a contextual analysis to rapidly triage, troubleshoot and resolve network availability and performance issues. Flexible filtering speeds investigation to focus on specific time periods, devices, or activities.
Note: Selecting Dashboards → Fabric Health displays information about a Fabric assuming a fabric was created and added. For more information about creating and adding a Fabric please refer to the ZTP - Zero Touch Provisioning section in this manual.
There are features and functions used in UNUM Manager and UNUM Analytics that are common throughout the user interface (UI). Please refer to the Common Functions section for more information on the use of these functions and features.
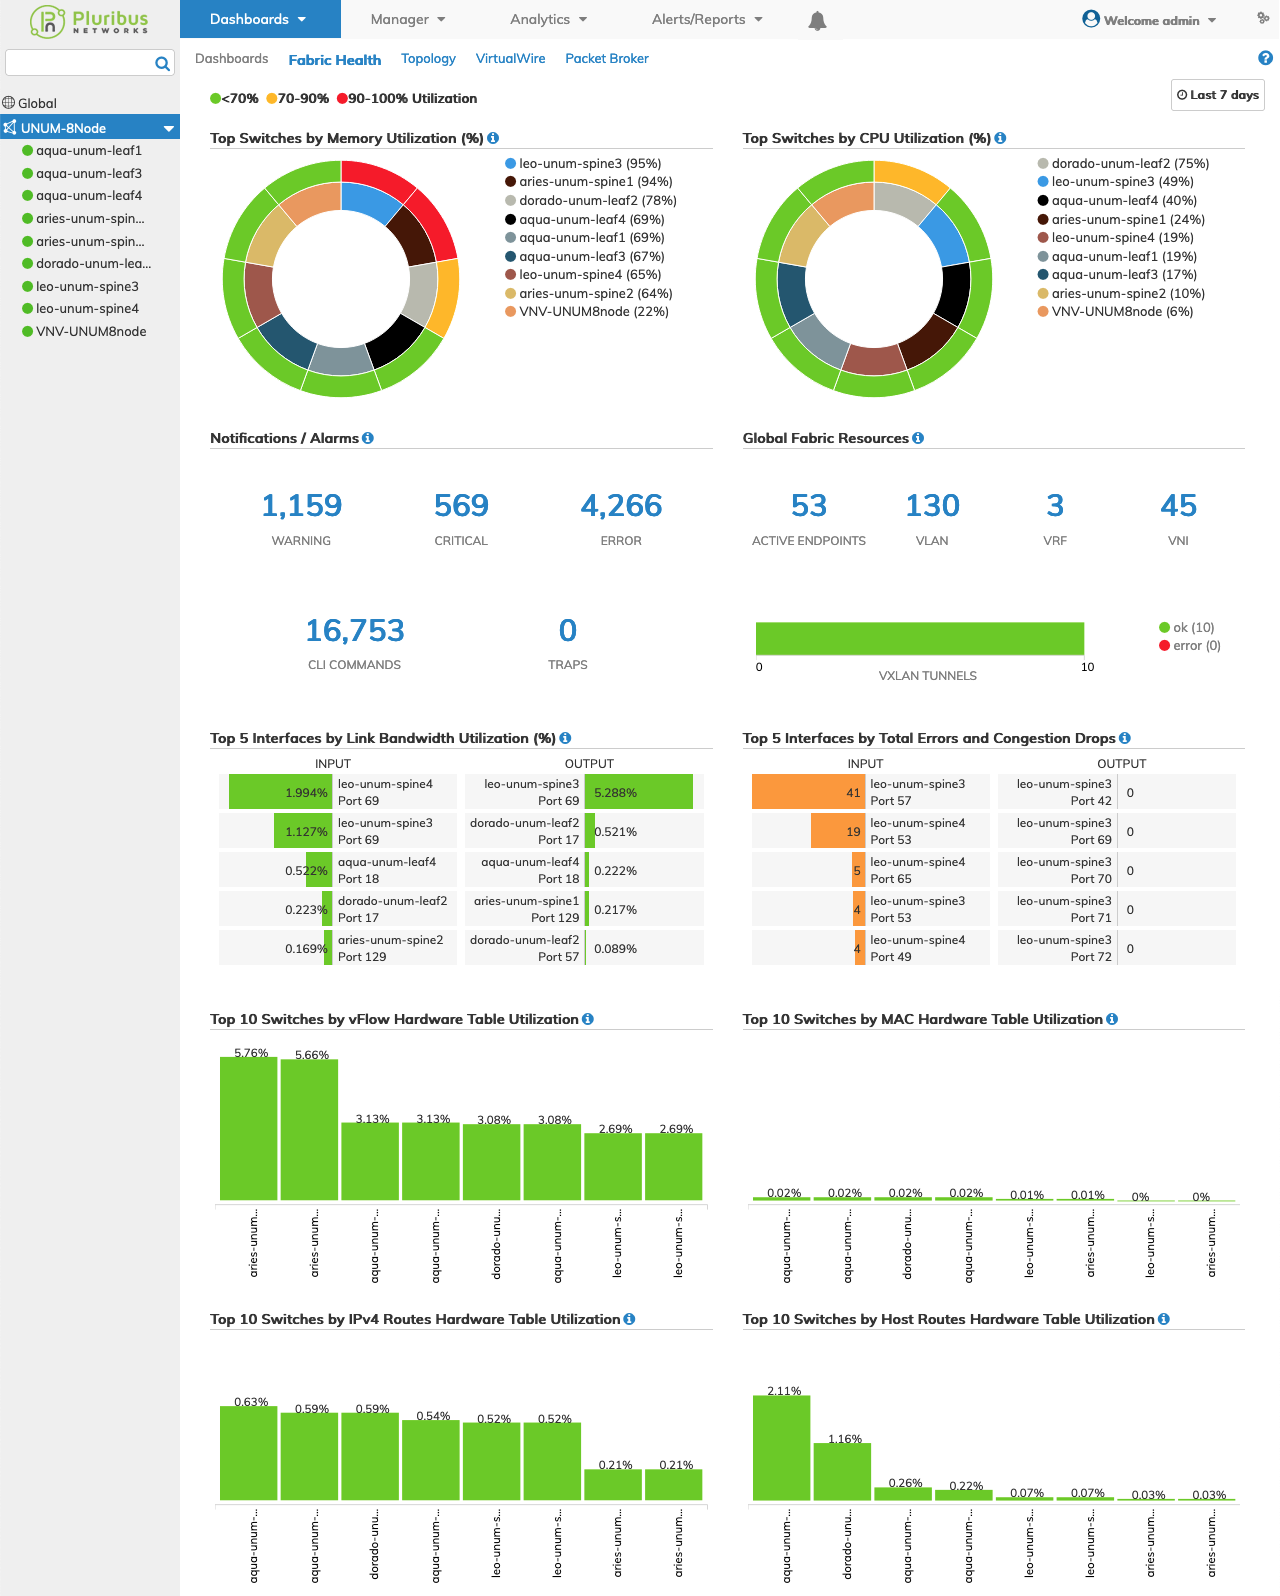
Selecting Dashboards → Fabric Health → displays important information about the Fabric and/or individual switches within the Fabric.
Select the applicable Fabric from the left-hand navigation bar and the dashboard updates showing all Switch entries from all switches within the Fabric.
In general, the Left-Hand Navigation (LHN) pane displays the following characteristics for the Fabric Health dashboard.
•When selecting a Super-Fabric on the LHN, it will display all the switches under the selected Super-Fabric.
•When selecting a Fabric under the Super-Fabric on the LHN, it will show only those switches under the selected Fabric, irrespective of the Fabric belonging to the Super-Fabric.
•When selecting a switch on the LHN, it will display the details for only the chosen switch.
The dashboard displays:
•Switch Health in the Left-Hand Navigation (LHN) pane – depicts switch status and health. A Green visual indicator ![]() shows the Fabric is healthy, while the Alert
shows the Fabric is healthy, while the Alert ![]() visual indicator shows a problem with the Fabric or a device.
visual indicator shows a problem with the Fabric or a device.
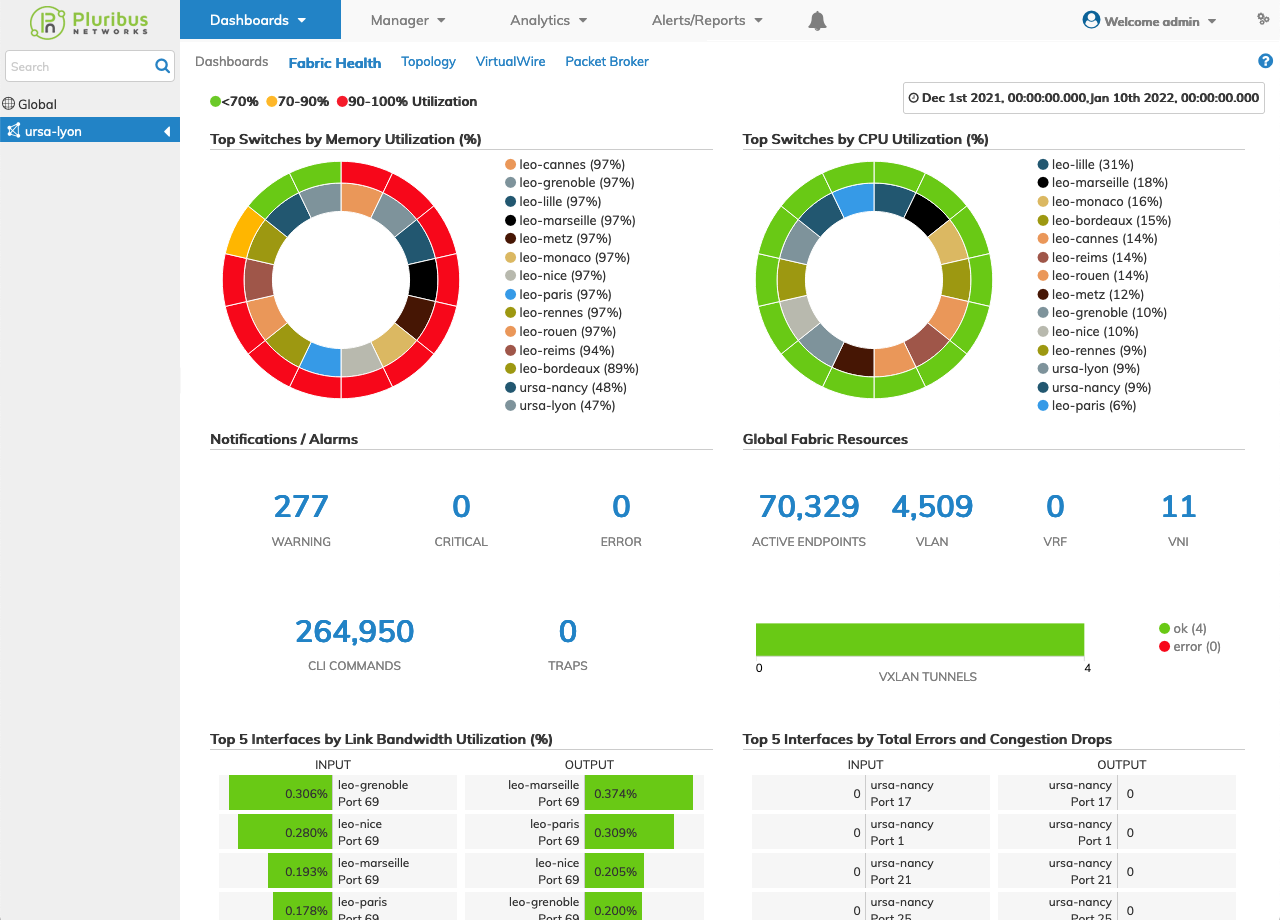
•Top 10 Switches by Memory Utilization (%) – pie chart detailing top switches by memory utilization averaged over the last minute.
•Top 10 Switches by CPU Utilization (%) – pie chart detailing top switches by CPU utilization averaged over the last minute.
•Notifications / Alarms – tabular information of Notifications and Alarms: Warning, Critical, Error, CLI Commands and Traps over the last 24 hours.
•Global Fabric Resources – tabular and graphical information of Global Fabric Resources: Active Endpoint, VLANs, VFR, VNI and VXLAN Tunnels over the last 15 minutes.
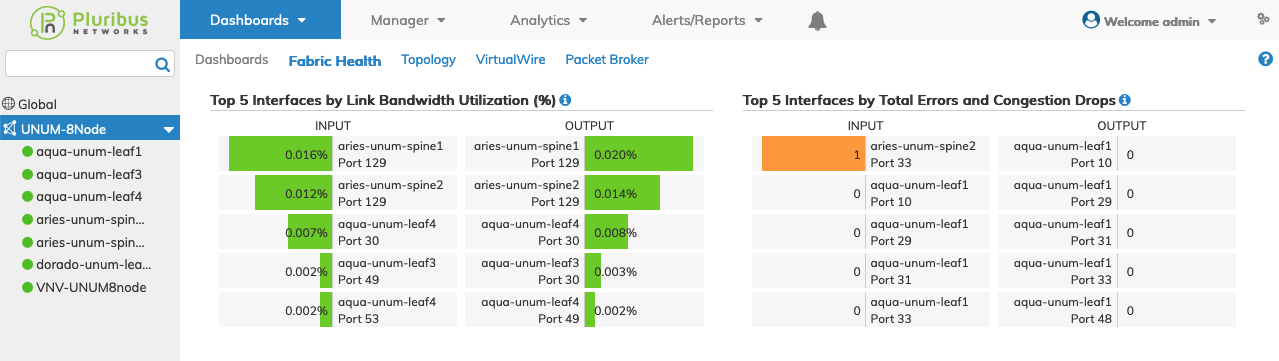
•Top 5 Interfaces by Link Bandwidth Utilization (%) – bar chart of top 5 interfaces by link bandwidth utilization input / output averaged over the last 30 seconds.
•Top 5 Interfaces by Total Errors and Congestion Drops bar chart of top 5 interfaces by total errors and congestion drops input / output averaged over the last 30 seconds.
•Top 10 Switches by vFlow Hardware Table Utilization – bar chart of top 5 switches by vFlow hardware table utilization over the last 15 minutes.
•Top 10 Switches by MAC Hardware Table Utilization – bar chart of top 5 switches by MAC hardware table utilization over the last 15 minutes.
•Top 10 Switches by IPv4 Routes Hardware Table Utilization – bar chart of top 5 switches by IPv4 routes hardware table utilization over the last 15 minutes.
•Top 10 Switches by Host Routes Hardware Table Utilization – bar chart of top 5 switches by host routes hardware table utilization over the last 15 minutes.
for the entire Fabric.
Additional parameters include: Input and Output by port number, Alarm by type along with visual indicators providing critical information about switch load, interface traffic and interface errors in Red, Yellow or Green. Inner ring colors identify the specific switch while the outer ring depicts the load utilization by Red, Yellow or Green.
|
Indicator |
|
|
|
|
|
Green |
= |
0% |
< |
70% |
|
Yellow |
>= |
70% |
< |
90% |
|
Red |
>= |
90% |
<= |
100% |
Fabric Health Dashboard
UNUM Dashboard Fabric Health
Fabric Health Dashboard Time Range Selector
Use the Time Range Selector to specify the time-based data displayed in the dashboard. Time Range supports a Quick mode, ranging from default to Last 7 Days, while the Absolute mode allows you to select specific date ranges.
The dashboard updates and uses data from the time range specified. The time range displays on the dashboard.
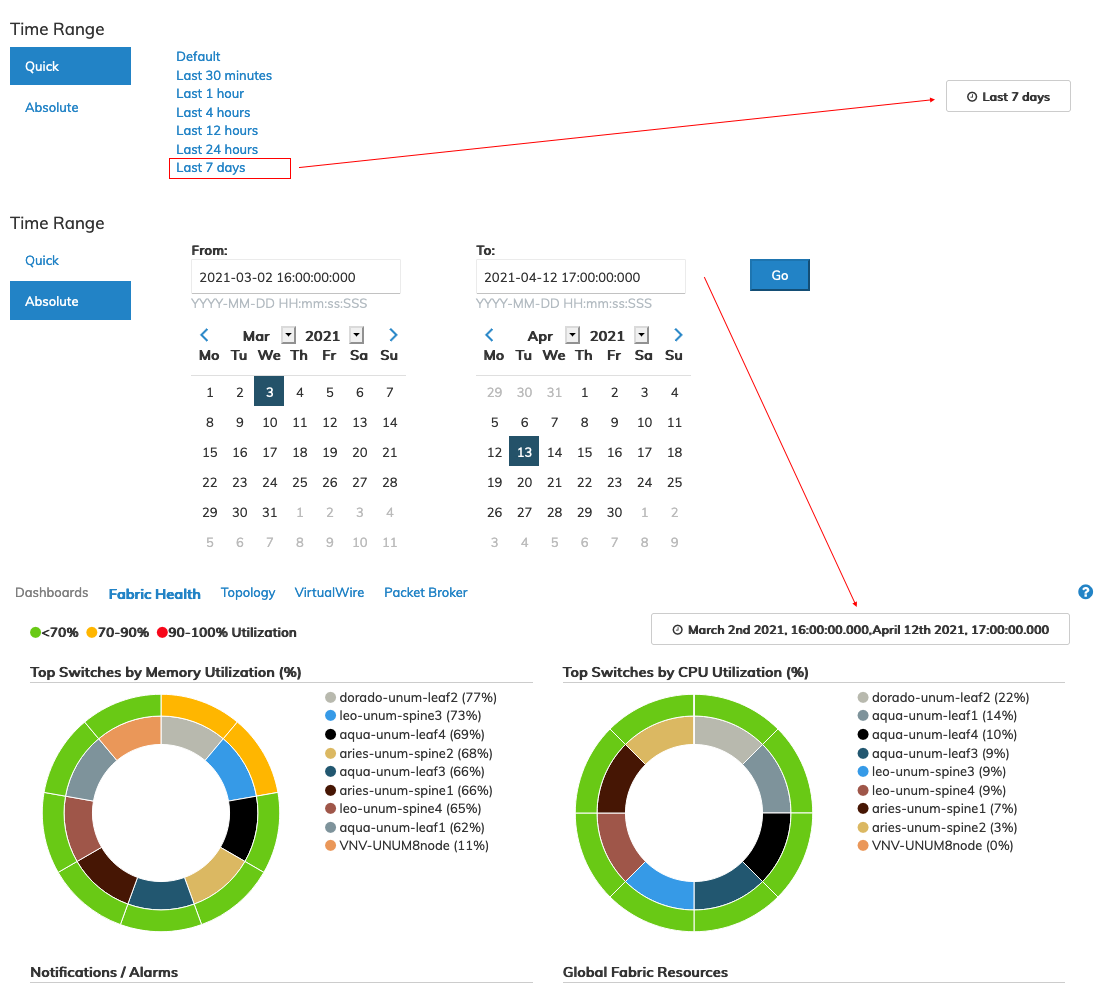
UNUM Dashboard Fabric Health - Time Range Example
Widget Polling Interval
Each display in the dashboard includes a blue information button ![]() . Rolling over this button provides the polling time interval for the widget.
. Rolling over this button provides the polling time interval for the widget.
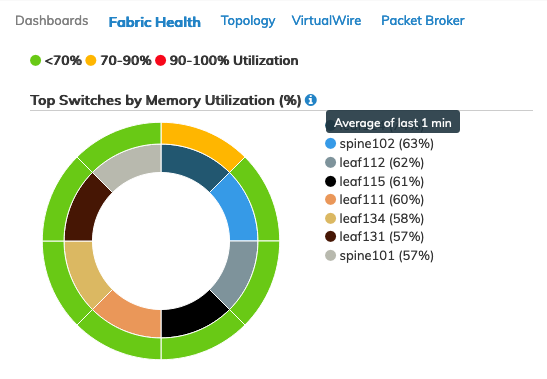
UNUM Dashboard Fabric Health Widget Rollover
Widget Data Drilldown
Rolling over sections of the pie charts reveal information by Switch name about Memory and CPU usage: cpu-idle, cpu-user and cpu-sys, as well as a Date and Time stamp.
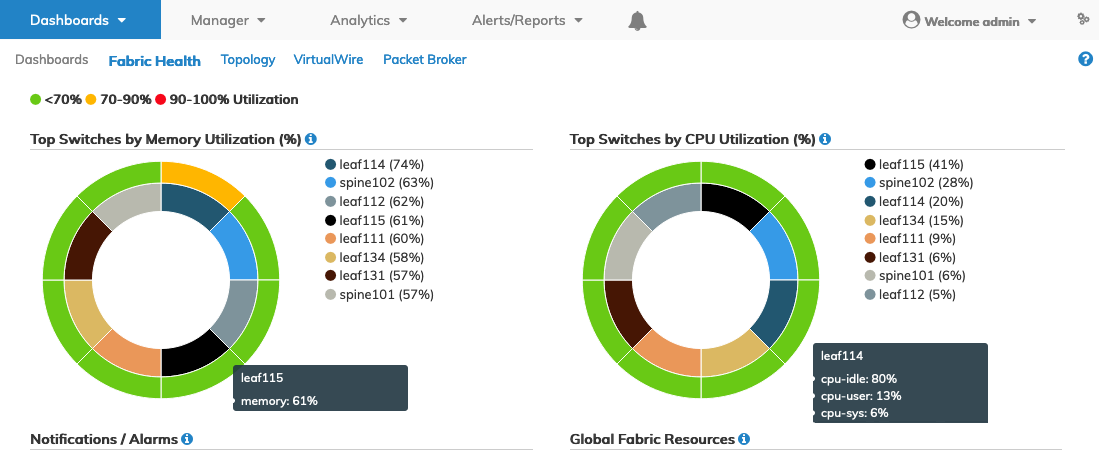
UNUM Dashboard Fabric Health Rollover Details by Switch
While rolling over the Top Switches by Memory Utilization widget or the Top Switches by CPU Utilization widget and double clicking, the Switch Analytics / System Stats CPU/Memory and Fan/Temperature dashboard launches.
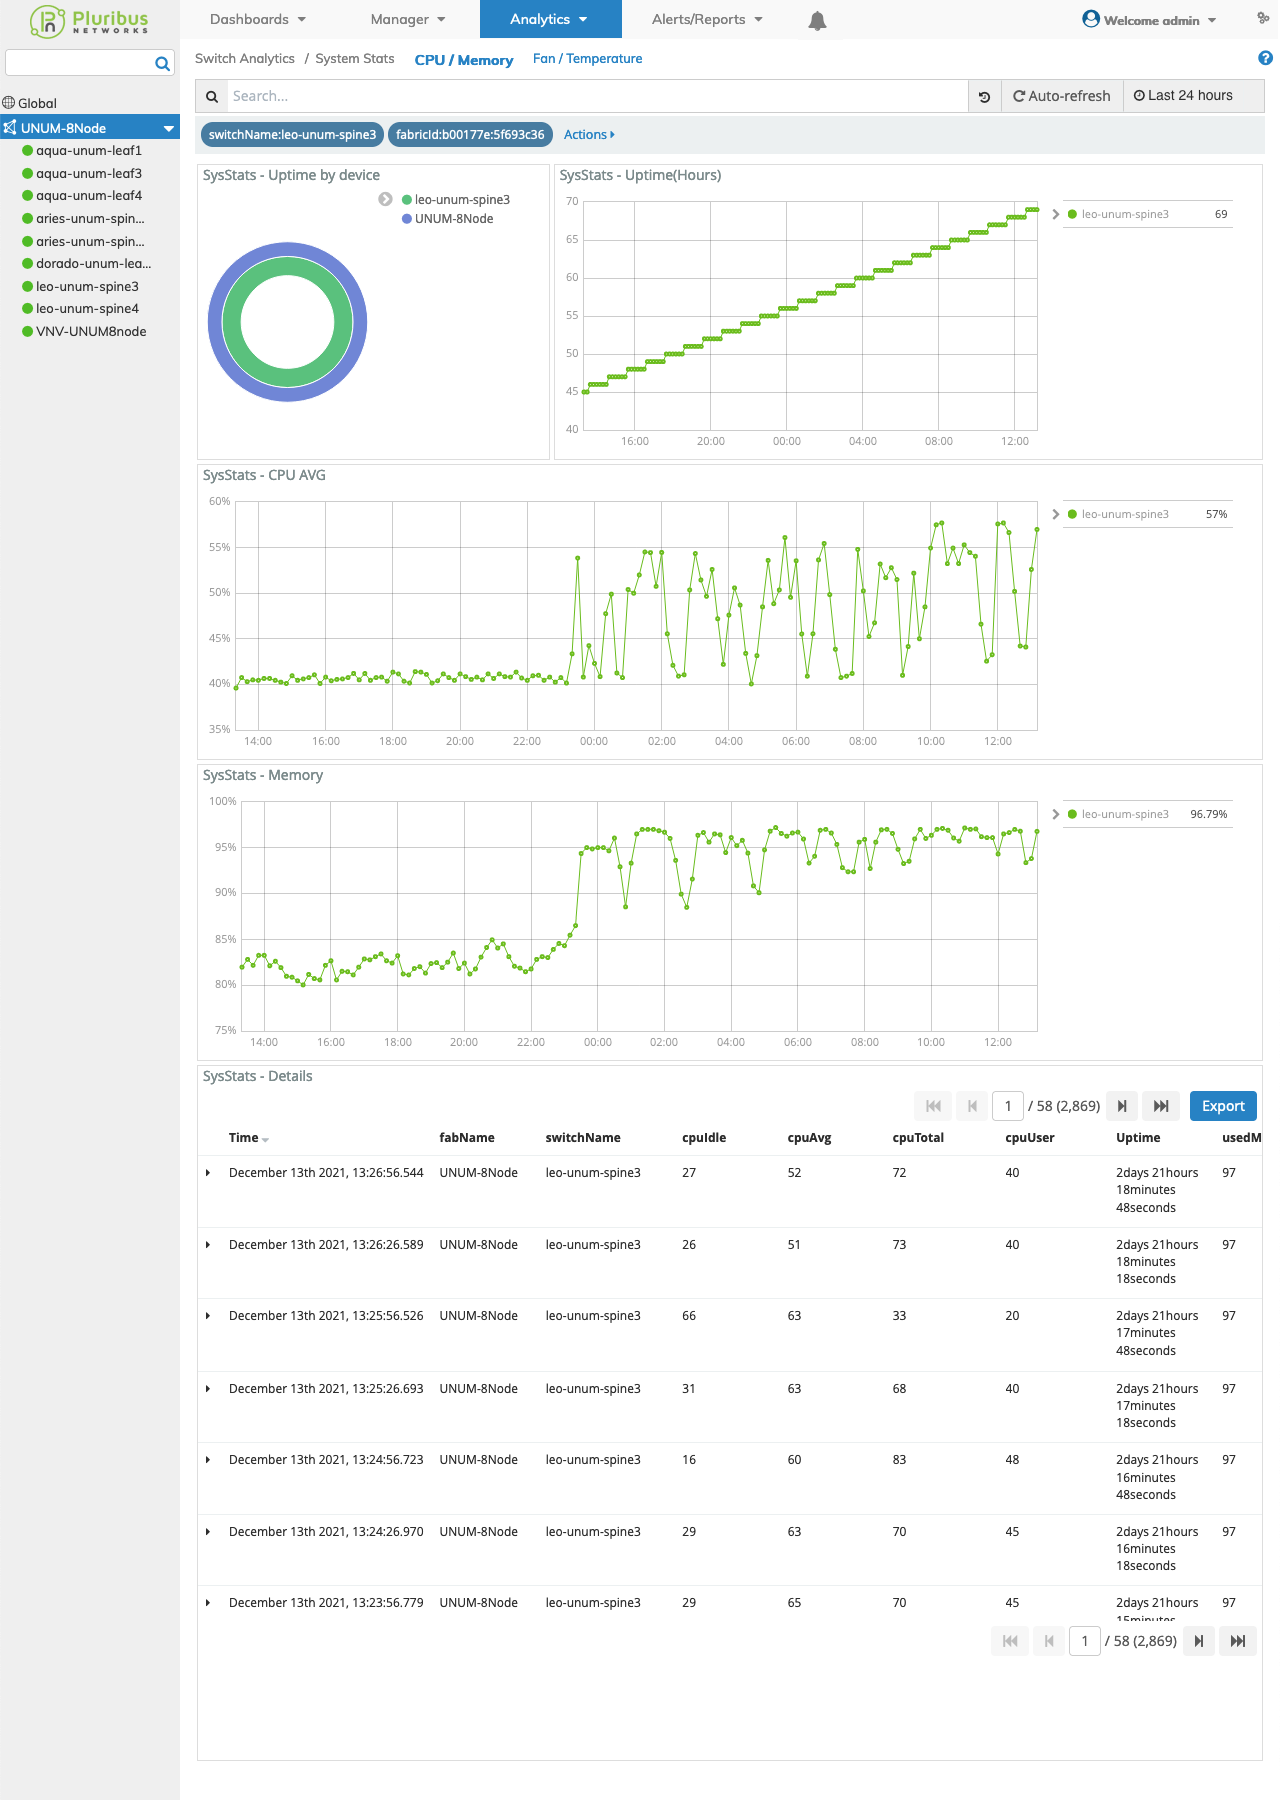
Switch Analytics CPU / Memory Switch Dashboard
Time Slider
Placing the cursor in a graph area reveals a Time Slider function.
The time slider feature appears in Alarms, Global Fabric Resources, Top Interface Traffic and, Top Interface Errors.

Switch Analytics CPU / Memory Switch Dashboard - Time Slider
Using the browser back button returns you to the Fabric Health dashboard highlighting the previously selected switch.
Histogram Rollover and Data Drilldown
Rolling over other sections of the dashboard such as Top 5 Interfaces by Link Bandwidth Utilization (%) reveals information by Switch name about Port and Port Speed along with octets and octets percentage as well as a Date and Time stamp as illustrated in the following example:
UNUM Dashboard Fabric Health Fabric Port Rollover Details by Switch
As previously stated each display in the dashboard includes a blue information button ![]() . Rolling over this button provides the polling time interval for the widget as illustrated in the case of Top 5 Interfaces by Link Bandwidth Utilization (%).
. Rolling over this button provides the polling time interval for the widget as illustrated in the case of Top 5 Interfaces by Link Bandwidth Utilization (%).
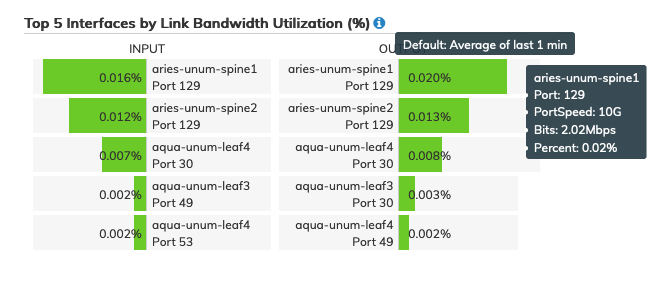
Dashboard Fabric Health Link Bandwidth Utilization Rollover
While rolling over the Link Bandwidth Utilization widget or the Total Errors and Congestion Drops widget and double clicking, the Switch Analytics / Traffic Port Stats dashboard launches. Using the browser back button returns you to the Fabric Health dashboard highlighting the previously selected switch.
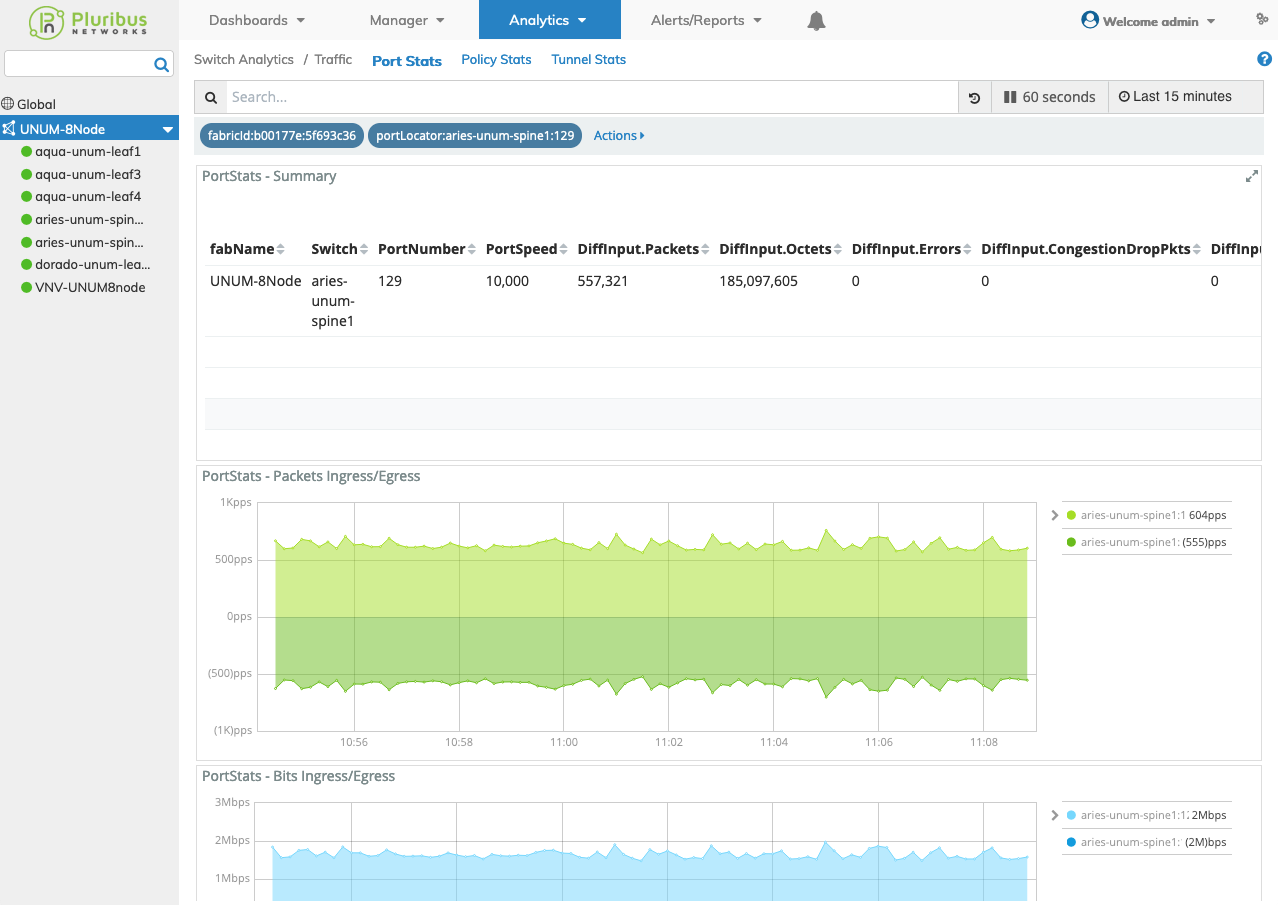
Dashboard Fabric Health Link Port Stats Dashboard
Select a applicable switch from the fabric and the dashboard updates automatically and displays a list of:
•Switch - Memory Utilization (%)
•Switch - CPU Utilization (%)
•Switch - Notifications / Alarms
•Switch -Global Fabric Resources
•Switch - Link Bandwidth Utilization (%)
•Switch - Total Errors and Congestion Drops
•Switch - vFlow Hardware Table Utilization
•Switch - MAC Hardware Table Utilization
•Switch - IPv4 Routes Hardware Table Utilization
•Switch - Host Routes Hardware Table Utilization
for the specific Switch selected.
Visual indicators providing critical information about switch load, interface traffic and interface errors in Red, Yellow or Green.
|
Indicator |
|
|
|
|
|
Green |
= |
0% |
< |
70% |
|
Yellow |
>= |
70% |
< |
90% |
|
Red |
>= |
90% |
<= |
100% |
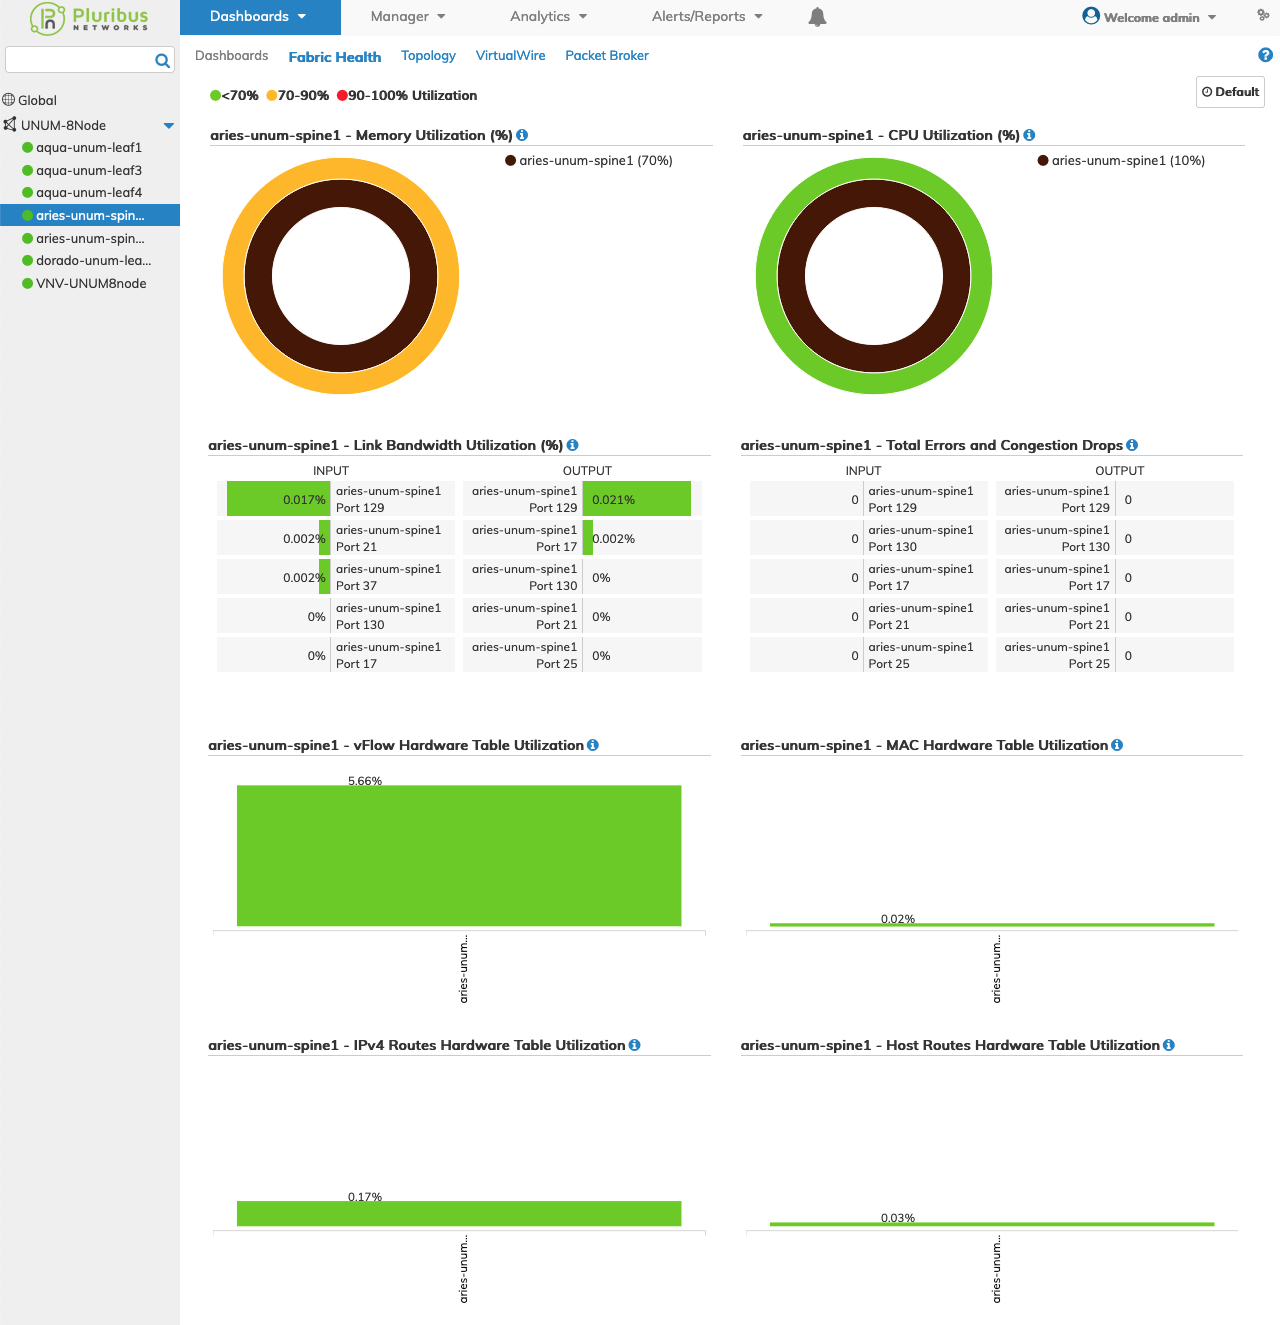
Fabric Health Dashboard Switch Dashboard
Rolling over sections of the pie charts reveals information by Switch name about Memory and CPU usage: cpu-idle, cpu-user and cpu-sys, as well as a Date and Time stamp.
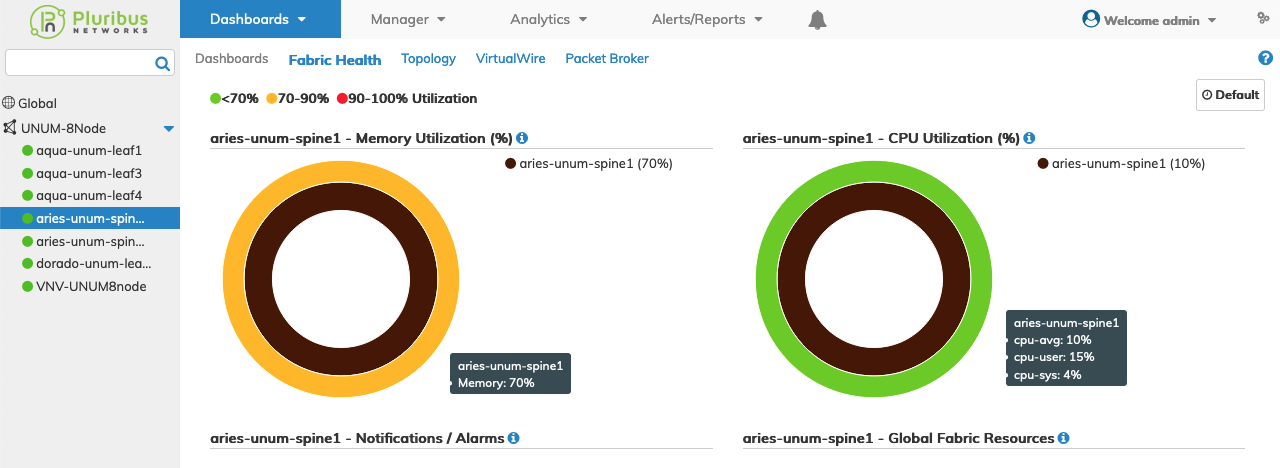
Fabric Health Dashboard Switch Rollover
Histograms for Hardware Utilization
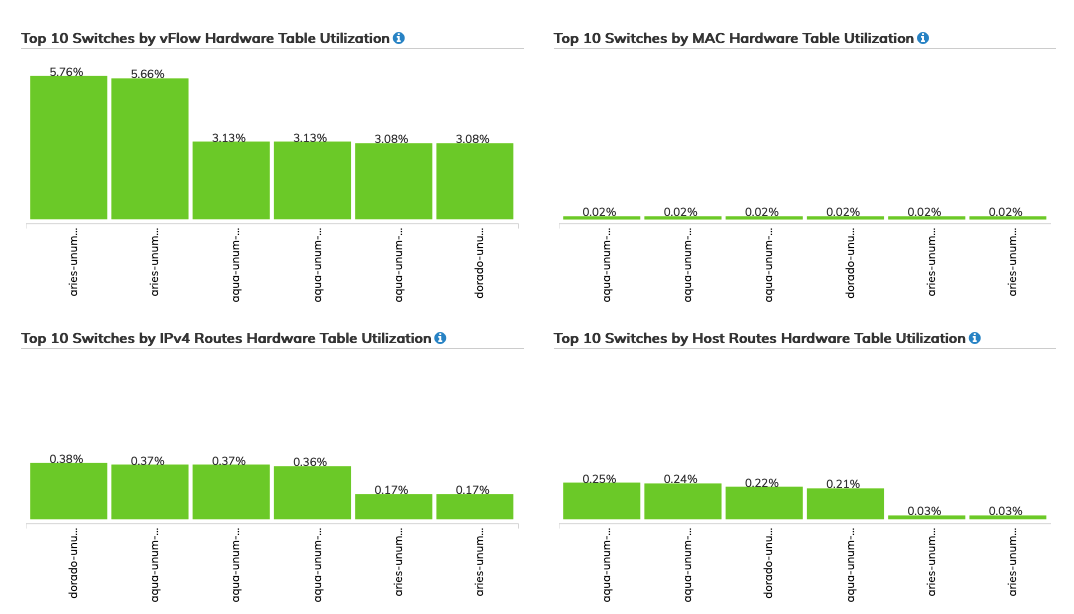
Fabric Health Dashboard Fabric Top 10 Histograms
Rolling over a histogram provides additional information about the individual switch.
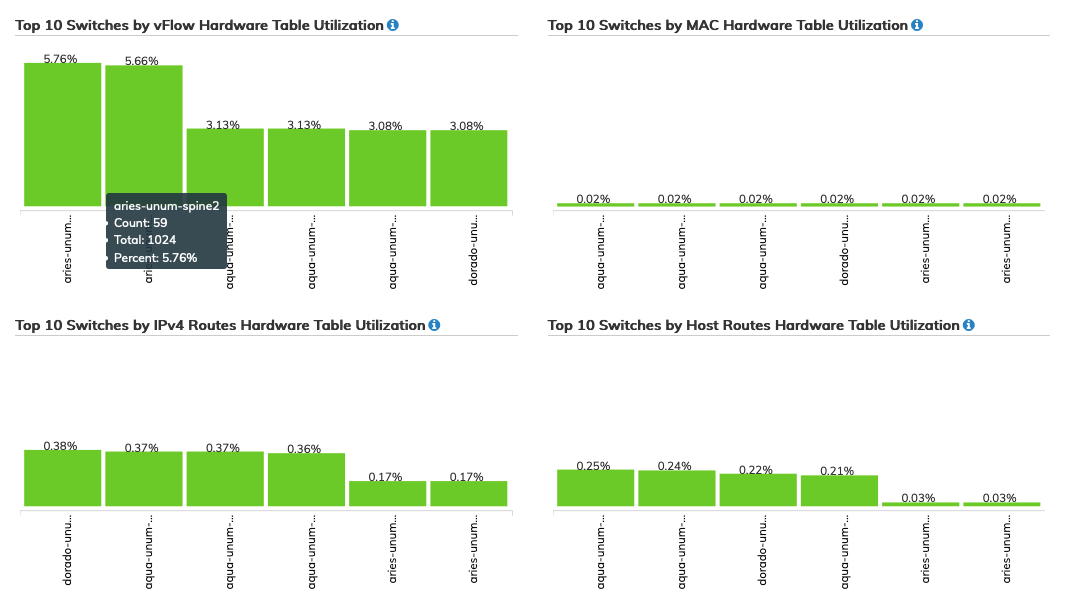
Fabric Health Dashboard Top 10 Histogram Switch Rollover Details
The UNUM Fabric Health dashboard provides direct links to Fabric Management data and settings by rolling over and clicking on data points in the dashboard.
Clicking on data points within the Notifications / Alarms section reveals dashboard information about WARNINGS, CRITICAL, ERRORS,CLI COMMANDS and TRAPS and automatically applies a filter for the data point selected.
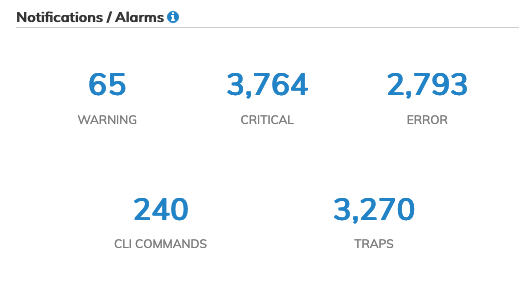
Fabric Health Dashboard - Notifications / Alarms
For example, clicking in the Notifications / Alarms section on the WARNING data point takes you to the Syslog dashboard and automatically applies a filter for the data point selected.
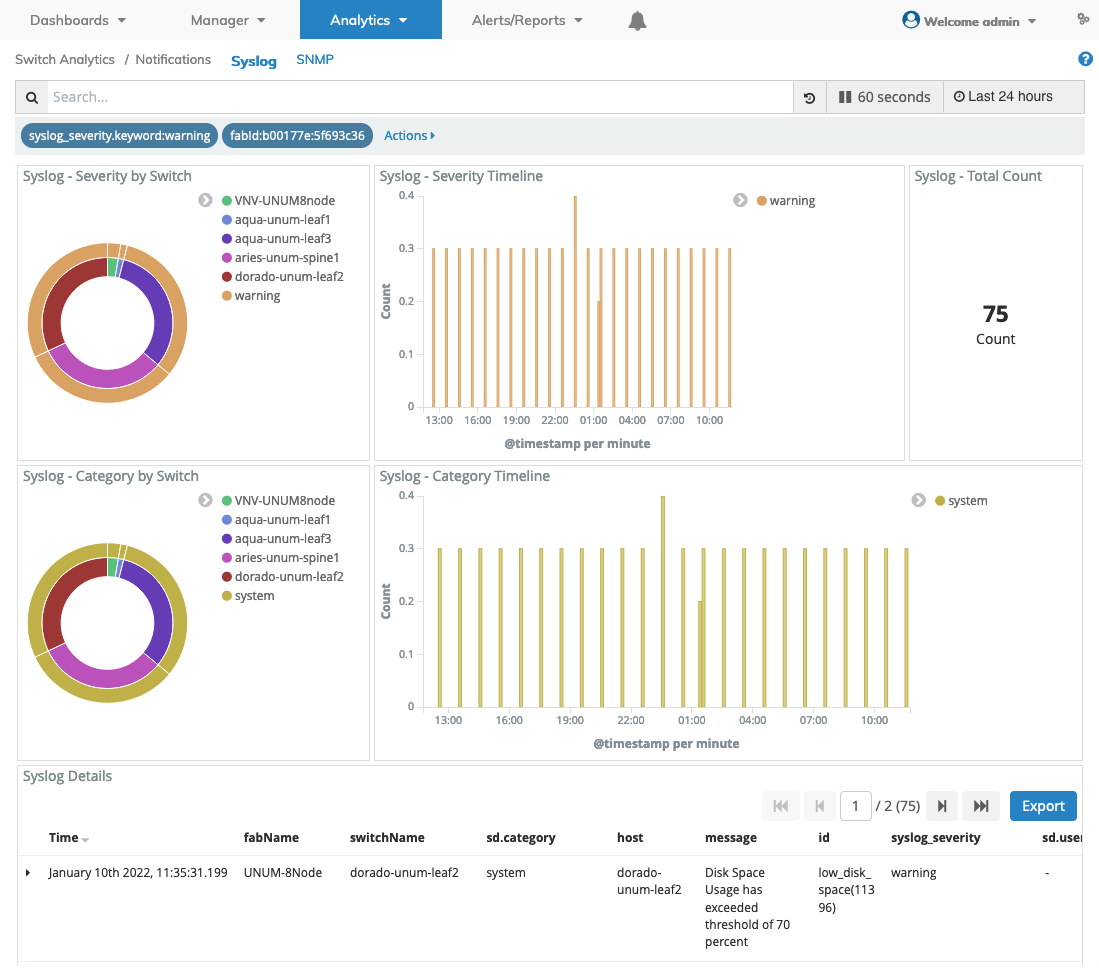
Fabric Health Dashboard - Fabric Health Alarms Syslog Dashboard - Warnings
And, as another example, clicking in the Notifications / Alarms section on the CLI COMMANDS data point takes you to the Syslog dashboard and automatically applies a filter for the data point selected.
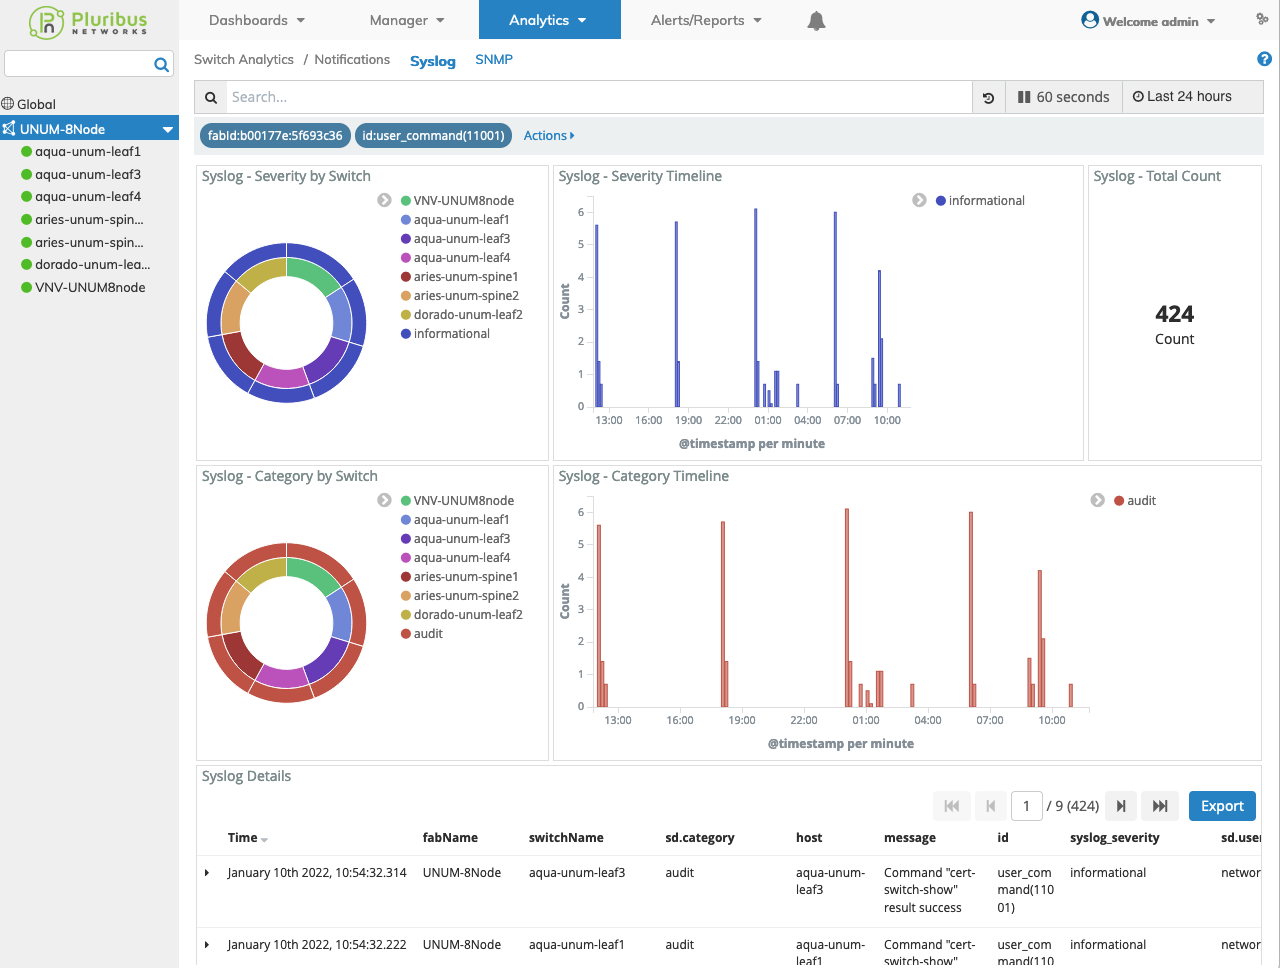
Fabric Health Dashboard - Fabric Health Alarms Syslog Dashboard - CLI Commands
Clicking on data points and graphics within the Global Fabric Resources section reveals dashboard information about Active Endpoints, VLANs, VRF, VNI and VXLAN Tunnels and automatically applies a filter for the data point selected as illustrated in the following examples:

Fabric Health Dashboard Global Fabric Resources
UNUM vPort Dashboard Active Endpoints - Example
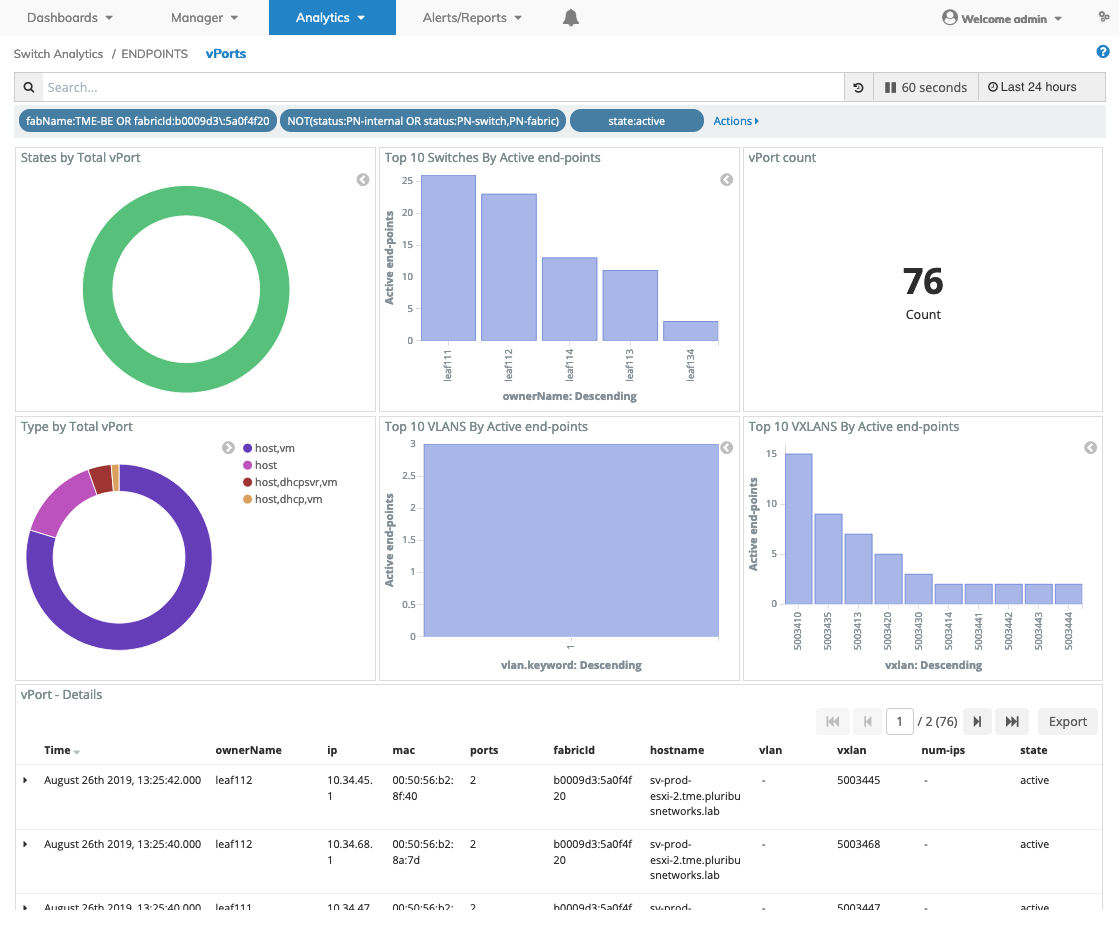
Fabric Health Dashboard Fabric Resources - Endpoint Drill-down - vPort Dashboard - Example
Note: In certain cases, the VLAN widget is empty and displays "No results found". In some fabrics, all of end-points can be mapped to VXLANs. Since the VLAN can be different on both sides of a VXLAN tunnel, the VLAN information is not carried in the vPort entry.
UNUM Dashboard Manage Fabric - Manage VLAN Example
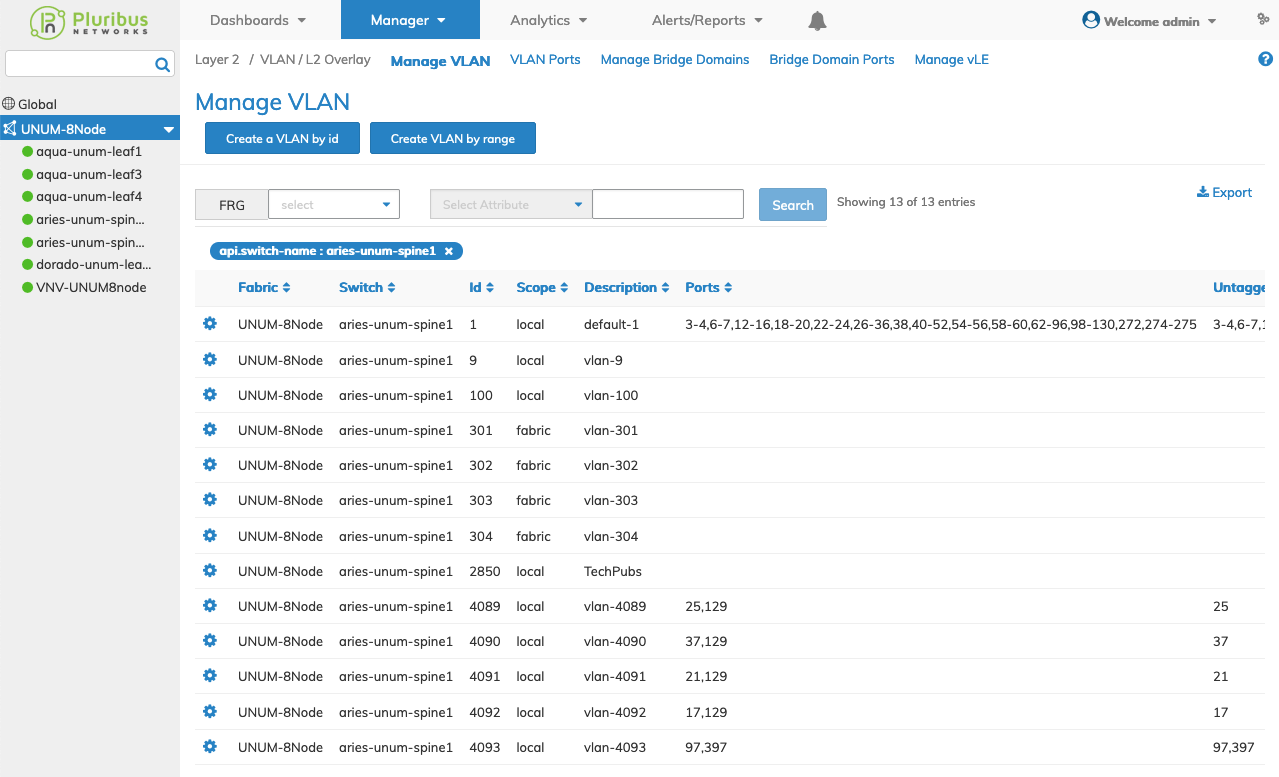
Fabric Health Dashboard Global Fabric Resources - Manage VLANs - Show VLANs - Example
UNUM Dashboard Manage Fabric - Manage VXLAN Tunnel Example
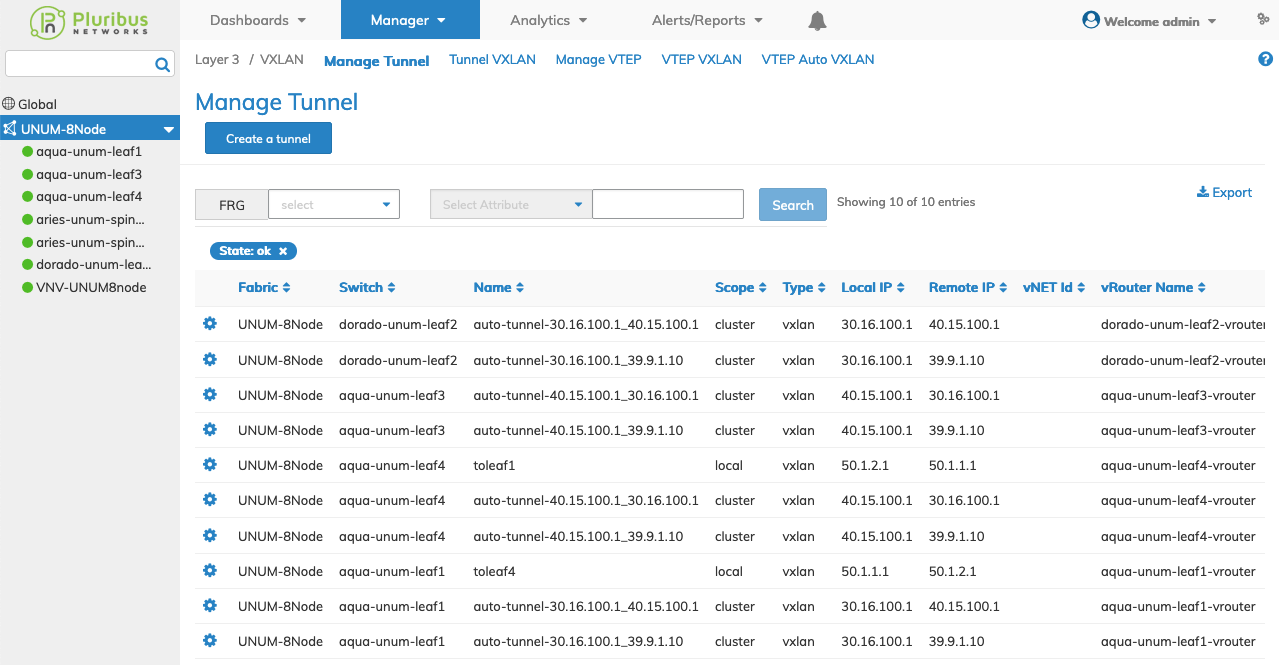
Fabric Health Dashboard Global Fabric Resources - Manage VXLAN Tunnels - Example
In a similar way to clicking on data points and graphics within the Global Fabric Resources section, Hardware widgets reveal switch-specific dashboard information by Leaf or Spine about vFlows, Forwarding Tables and Host Routes.
Clicking on the individual bars in the histograms launches the respective dashboard as illustrated in the following example:
Note: This is an illustration only. Actual screen update experiences occur differently.
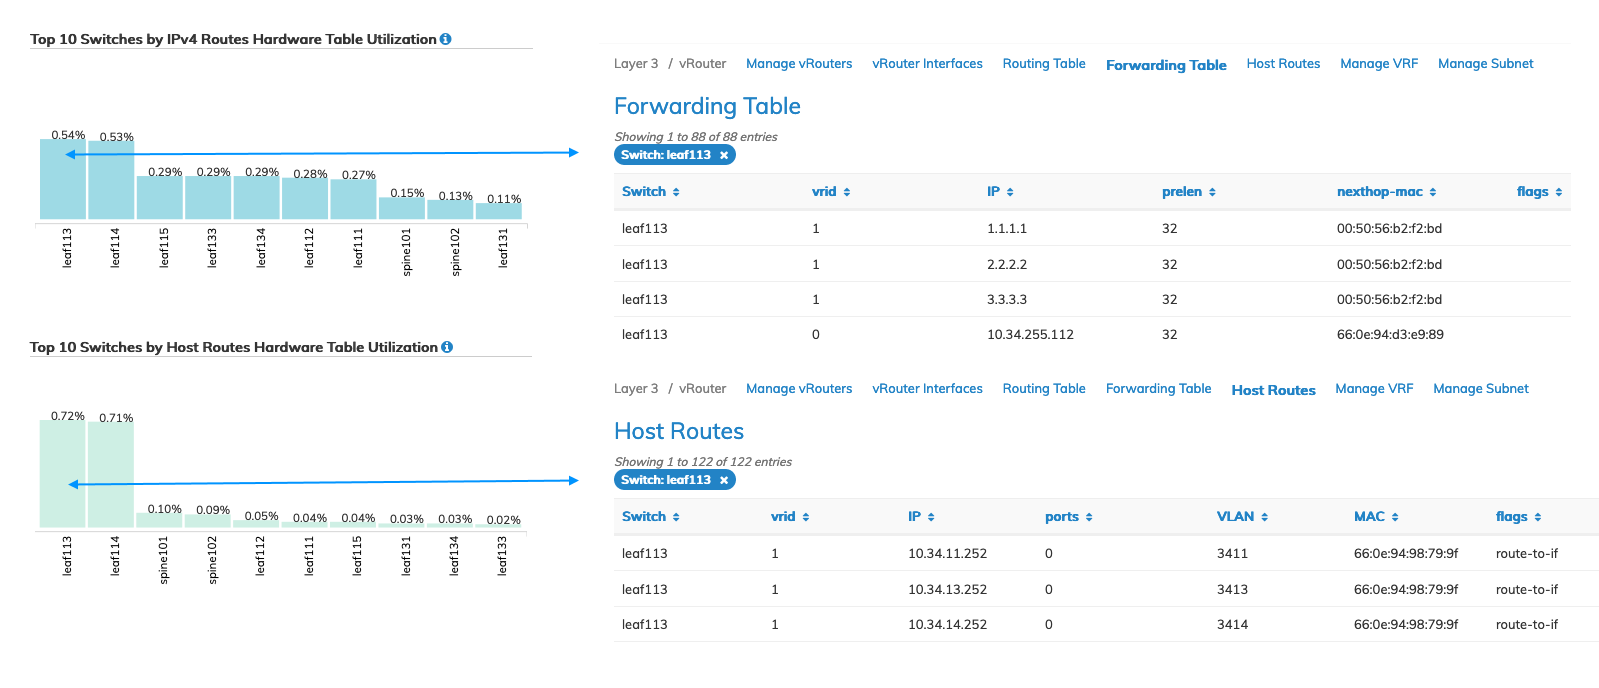
Fabric Health Dashboard Hardware Resources - Examples
Global-View Date Range
The Fabric Health data displayed is adjustable using the Archiver Settings, Global-View From Date, and Global-View To Date.

UNUM Platform Configuration Archiver Global-View Date Range
The displayed data when viewed on the Fabric Health dashboard displays data from December 1st, 2021 through January 10th, 2022. The date and time stamp noted on the dashboard along with the Fabric name and associated switches.
UNUM Platform Archiver Fabric Health Global-View Date Range
Refining the Archiver Settings, Global-View From Date and Global-View To Date, adjusts the displayed data accordingly.
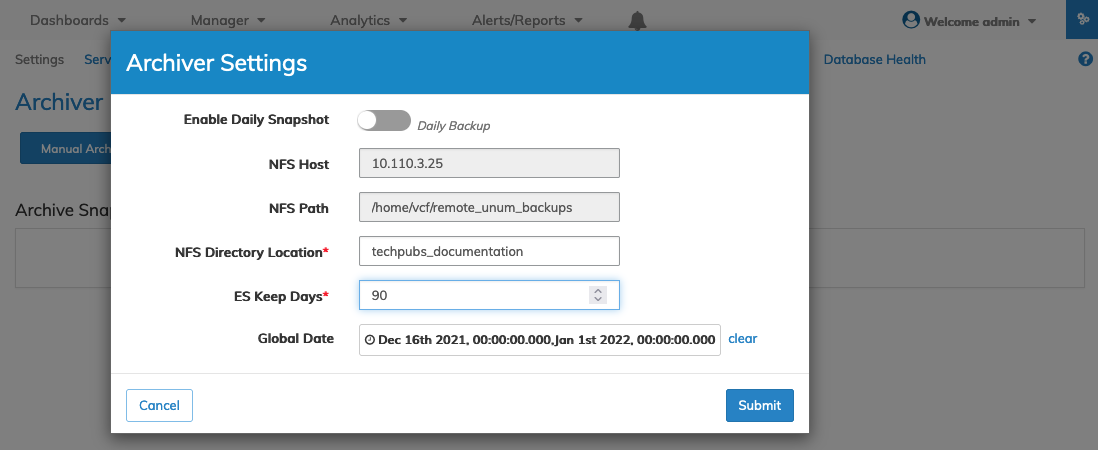
UNUM Platform Configuration Archiver Global-View Date Range Adjusted
The displayed data when viewed on the Fabric Health dashboard displays data from December 16th, 2021 through January 1, 2022. The date and time stamp noted on the dashboard along with the Fabric name and associated switches.
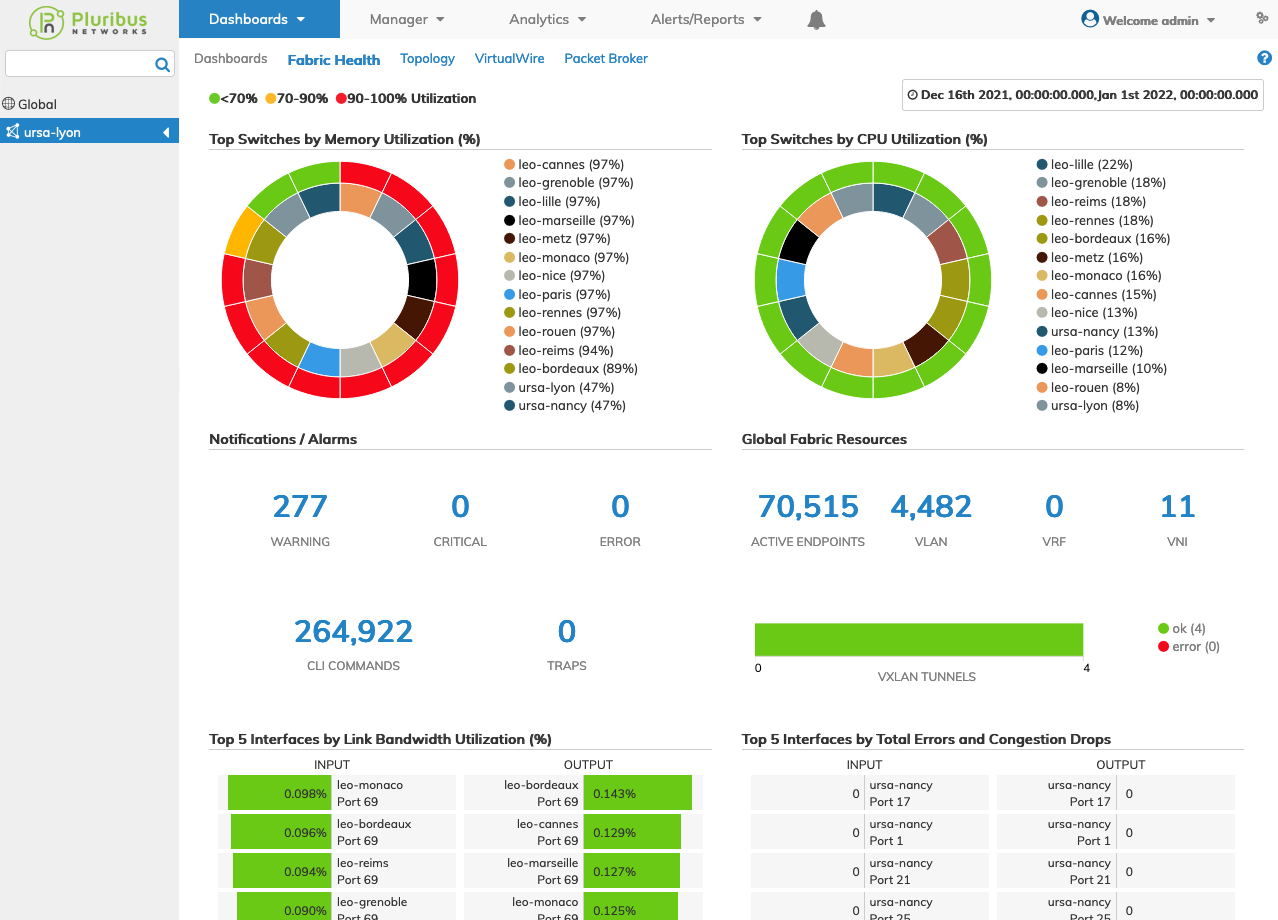
UNUM PlatformArchiver Fabric Health Global-View Date Range Adjusted
Note: When adjusting the Global-View Date Range selected dates are minus one day. For example selecting the Global-View From Date of January 1, 2022 updates the view to December 31, 2021. Selecting the Global-View To Date of July 31, 2021 updates the view to July 30,2021.