
Common Functions
Common Functions used in NetVisor UNUM
There are several features and functions used in NetVisor UNUM Fabric Manager and Analytics that are common throughout the user interface (UI).
These include:
|
|
Fabric Scope / Local Scope |
|
|
All Switches |
|
|
Switch / Fabric Resource Group (FRG) |
|
|
Select Multiple Rows / Multi-Edit |
|
|
Multi-Select / Select All |
|
|
Help Button |
|
|
Notification Bell |
|
|
Function Cog |
|
|
Edit Button |
|
|
Customize View |
|
|
Column Sorting |
|
|
Details Pane |
|
|
Data Export |
|
|
Interactive Port Selector |
|
|
Search and Filtering |
|
|
Advanced Search |
Documentation Toolbar Icons
The documentation toolbar icons provide the following functionality:
|
north |
Return to Top of Page. |
|
menu |
Display the List of Topics on the current page. |
|
keyboard_arrow_up keyboard_arrow_down |
Auto Scroll Up / Down. |
|
description |
Access a Glossary of NetVisor UNUM and NetVisor OS® terms. |
|
print |
Print the current document page(s) as a PDF. |
|
feedback |
Provide Document Feedback. |
|
support |
Access the Support & Services Web Portal. |
|
business |
Visit the Pluribus Networks Corporate Web Site. |
|
rss_feed |
Access the Pluribus Networks Blog. |
|
south |
Go to Bottom of Page. |
Fabric versus Local Scope Objects
Fabric Scope Objects: When editing Fabric-scope objects, please select the Fabric Name from the Left-Hand Navigation (LHN) panel.
Local Scope Objects: When editing Local-scope objects, please select the Switch from the Left-Hand Navigation (LHN) panel.
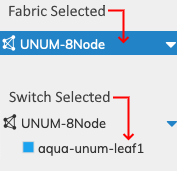
Fabric versus Switch Left-Hand Navigation
ALL Switches
The All Switches feature provides the ability to configure all switches in a Fabric versus one-by-one. This approach dramatically simplifies switch and Fabric management.
As illustrated in the following example, click the down arrow ![]() icon in the Switch selection box. The configuration screen updates and displays all switches in the Fabric.
icon in the Switch selection box. The configuration screen updates and displays all switches in the Fabric.
Select All to configure all switches simultaneously.
Note: Not all NetVisor UNUM functions support the All Switches feature. In that event, the All Switches selection is not available as an option.
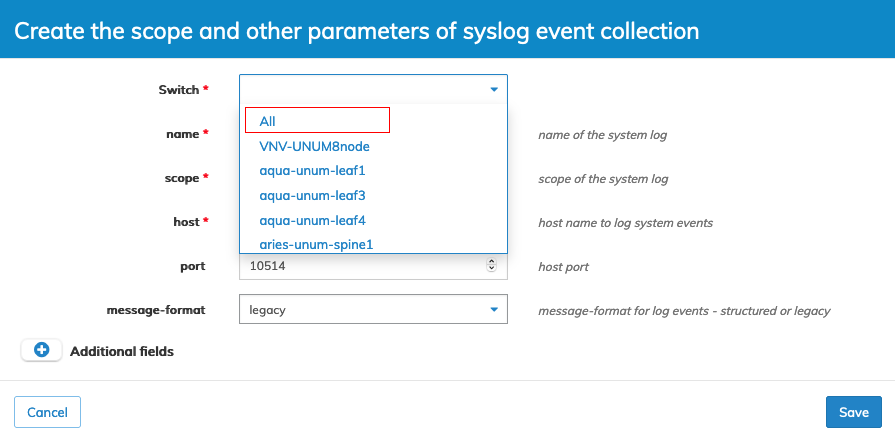
ALL Switches Function
All Switches Functionality
Note: LHN denotes Left-Hand Navigation pane.
|
Switch Drop-down Selection |
Fabric Scope |
Local Scope |
Cluster Scope |
|
All - Super Fabric selected in LHN |
The feature execution occurs on the Seed Switches in the Fabrics comprising the Super Fabric. |
The feature execution occurs on all the switches. |
Not Allowed. |
|
All - Fabric/Pod selected in LHN |
The feature execution occurs on the Seed Switches in the Fabric. |
The feature execution occurs on all the switches. |
Not Allowed. |
|
Fabric Group |
The feature execution occurs on the Seed Switches in the Fabric. |
The feature execution occurs on all the switches in the Fabric comprising the Group. |
Not Allowed. |
|
Switch Group |
Not Allowed. |
The feature execution occurs on all the switches comprising the Group. |
The feature execution occurs on all the switches in the Group. |
|
Switch - Super Fabric selected in LHN |
The feature execution occurs on the selected switch and the Seed Switch of the other Fabrics comprising the Super Fabric. |
The feature execution occurs on the selected switch. |
The feature execution occurs on the selected switch. |
|
Switch - Fabric/Pod selected in LHN |
The feature execution occurs on the selected switch. |
The feature execution occurs on the selected switch. |
The feature execution occurs on the selected switch. |
Switch / FRG
Refer to the Manage Groups section to create, use and manage Fabric Resource Groups (FRG).
The FRG feature provides the ability to configure multiple switches and ports in a Fabric or across multiple fabrics. This approach makes it easier to manage switches, ports, and Fabrics.
Depending on the Manager feature or NetVisor UNUM Dashboard, FRGs appear in drop-down menus as a selectable item.
When ports are assigned to an FRG, only the following Manager functions will display FRGs in the drop-down menus as a selectable item.
|
Manager Layer 1 |
Manage Ports |
|
Manager Layer 2 |
Manage VLAN VLAN Ports Manage Mac Limiting Manage Port Storm Control |
FRG With No Ports
The following example illustrates a selectable FRG with no assigned ports.
Example One - Manager Services - DSCP Map - Create a DSCP Priority Mapping Table
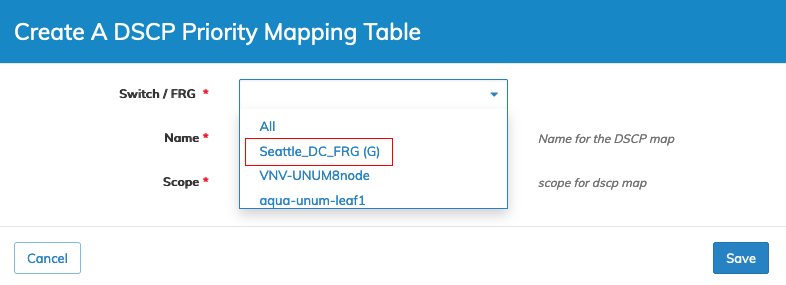
Fabric Resource Group (FRG) - No Ports Assigned
This is further illustrated in the Manage Groups dashboard.
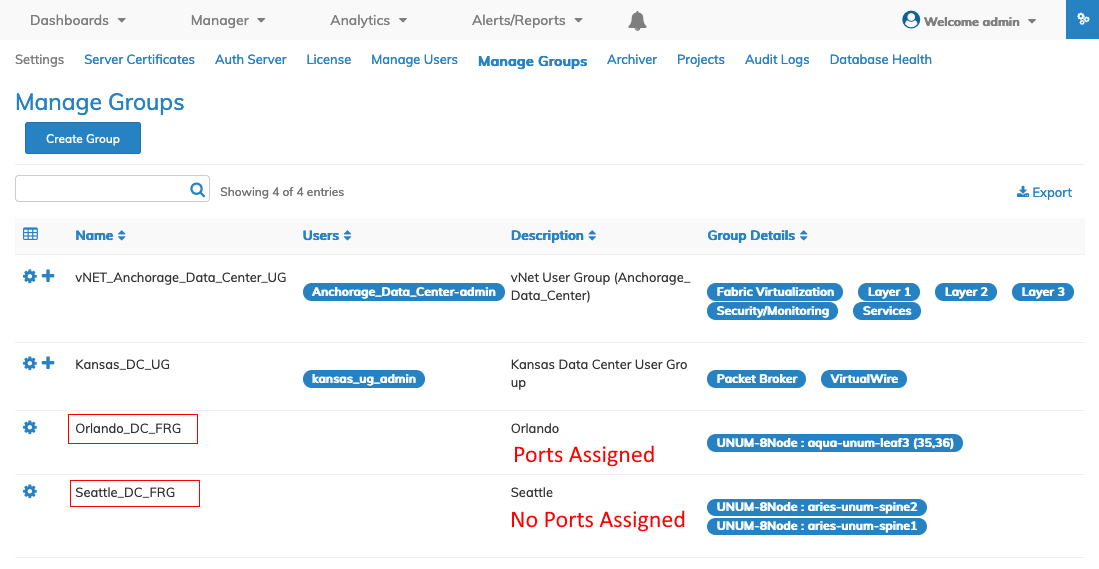
Manage Groups FRG Example - Port / No Ports
FRG With Ports
The following example illustrates a selectable FRG with assigned ports.
Example Two - Manager Layer 2 - Manage Port Storm Control - Edit Ports
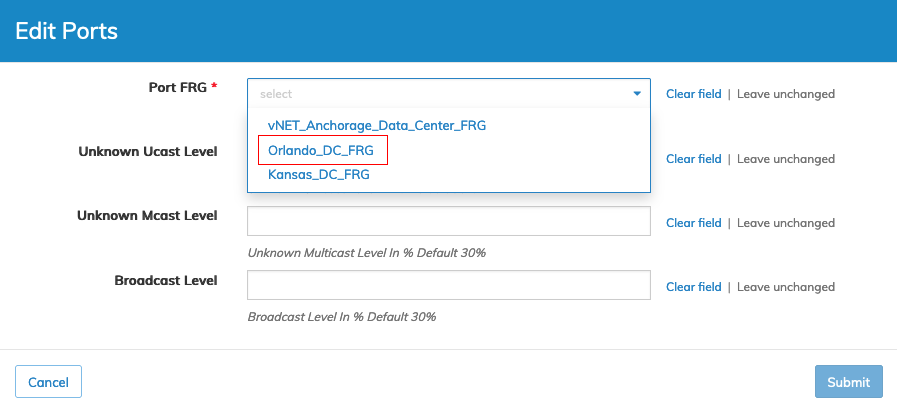
Fabric Resource Group (FRG) - Ports Assigned
Select Multiple Rows / Multi-Edit
NetVisor UNUM provides a convenient method to Edit parameters across multiple devices in specific Dashboard and Manager functions.
Note: The Select Multiple Rows and Multi-Edit functionality is not available on all dashboards and appears in specific Dashboard and Manager functions.
CTRL / COMMAND / SHIFT
Press the respective ![]() key on your keyboard and perform a mouse click on the applicable rows, and the dashboard updates with the number of rows selected.
key on your keyboard and perform a mouse click on the applicable rows, and the dashboard updates with the number of rows selected.
Select All highlights all rows.
Click in a row to deselect a previously chosen row or use the Clear Selection option to remove all once chosen rows.
To use the Shift function, press ctrl or cmd, select the desired first row and perform a mouse click. Press shift and then perform a mouse click in the desired last row. All rows between the first and last will display as highlighted. Repeating the process allows the selection of multiple ranges, as illustrated in the following example (Ports 2 - 5, 9 - 11, and 14 - 18).
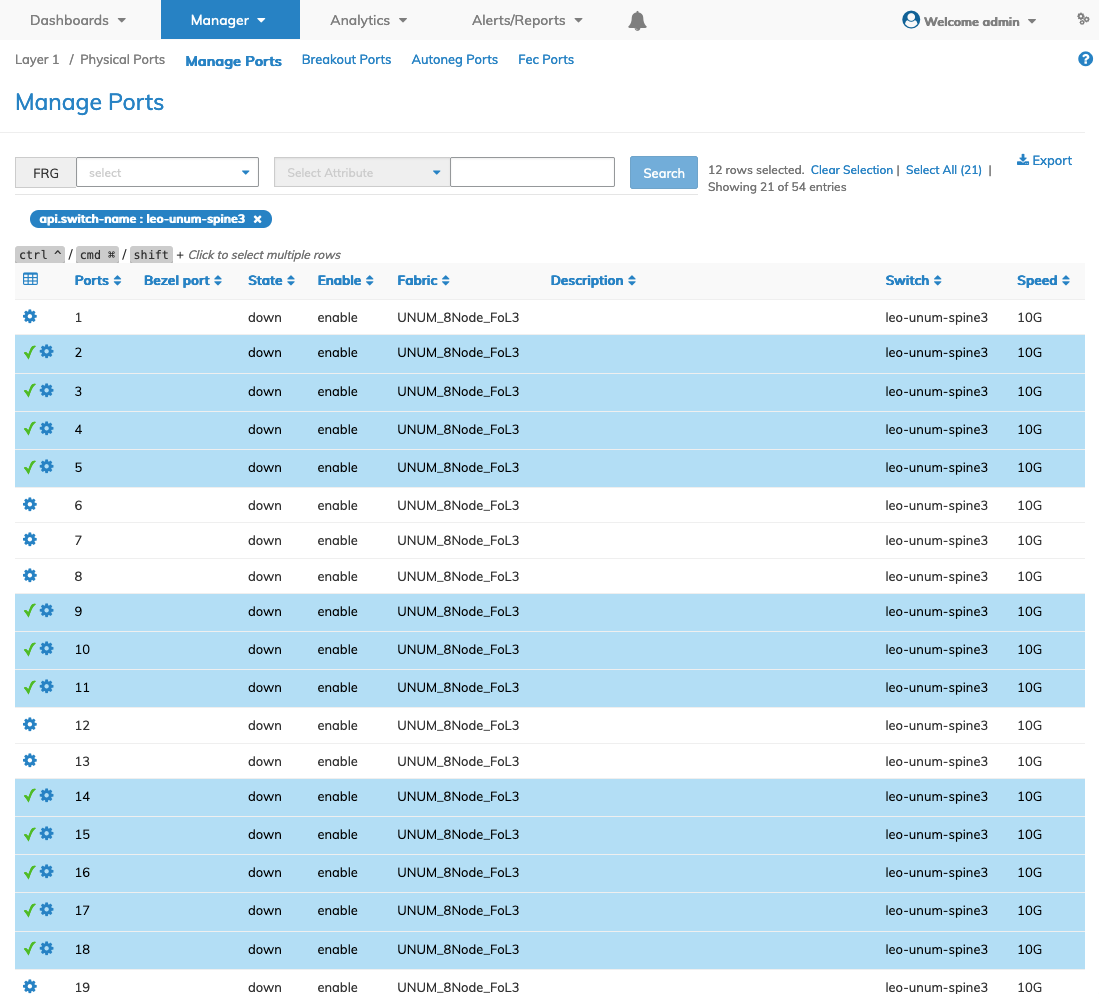
Select Multiple Rows Using Shift Key- Manage Ports Example
Select the menu function to act on the selected rows using the Cog ![]() icon.
icon.
The following screens illustrate the Select Multiple Rows in use.
Manage Ports - Example
Three rows were selected and highlighted in the dashboard in the following example. Note the number of rows selected from the total number of entries.
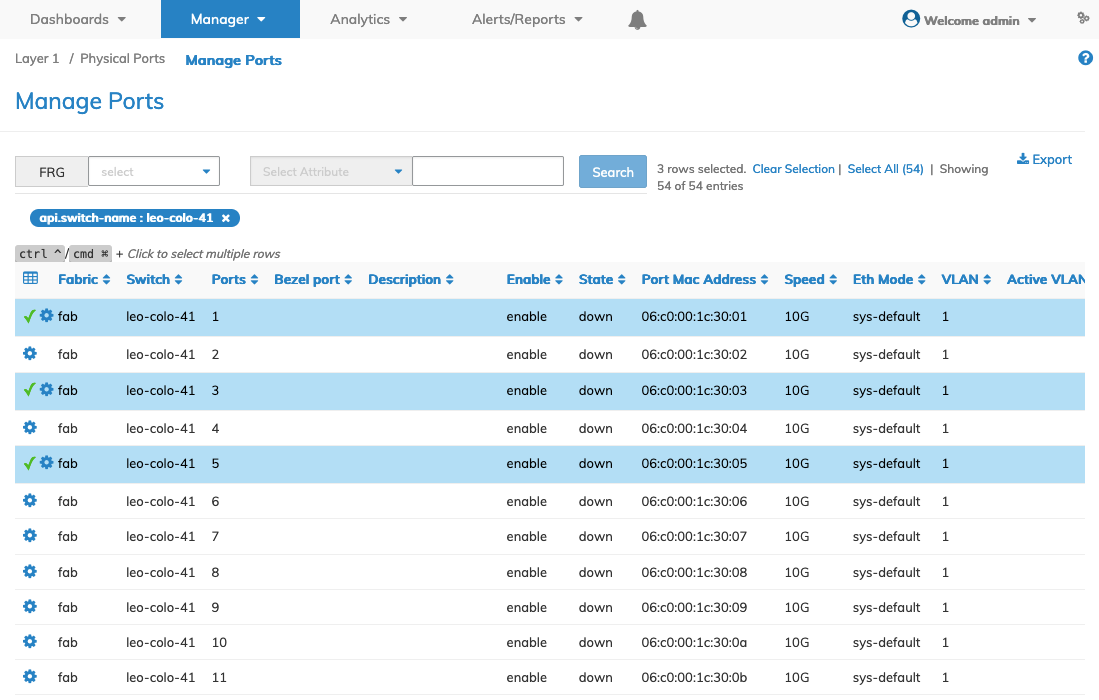
Select Multiple Rows - Manage Ports Example
Selecting the Edit function using the Cog ![]() icon displays Edit Ports with the Selected Rows switch, aries-unum-spine1, entry, and, in this case, three ports, 1, 3, and 5.
icon displays Edit Ports with the Selected Rows switch, aries-unum-spine1, entry, and, in this case, three ports, 1, 3, and 5.
All saved edits are then performed on the three port entries on the selected switch.
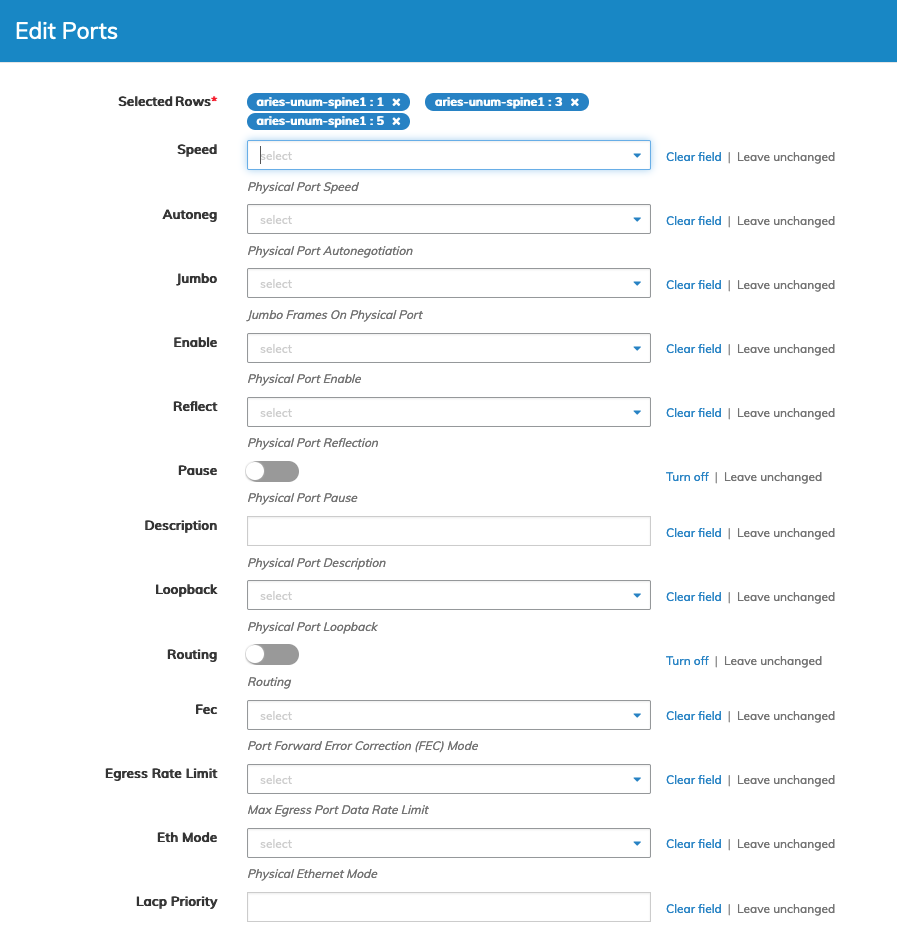
Edit Multiple Entries - Manage Ports Example
Field Info & Options
Use the following Field options to manage changes:
•Clear Field – Clears a populated field and toggles the Leave Unchanged option.
•Turn Off – Turns off a selection switch and toggles the Leave Unchanged option.
•Leave Unchanged – Leave the current selection in place and toggles the respective Clear Field and Turn Off options.
Multi-select Edit Functionality by Platform
Trident 4 Platforms: The Multi-select Edit is supported only on main ports. To modify Breakout Ports, Autoneg Ports, and Fec Ports, select main ports only; otherwise, an error message will display.
Multi-select Advanced Edit functionality is supported on flex ports.
These functional differences apply to Edit and Edit Advanced on Manage Ports, Add Device Under Test (DUT) in VirtualWire, and Edit Port in Packet Broker.
Non-Trident 3/ Non-Trident 4 Platforms: Multi-select, Edit, and Advanced Edit functions are supported.
Multi-Select / Select All
The multi-select feature provides a convenient method to interactively select various rows in a Details pane or certain Manager dashboards.
In a Details pane dashboard, hold the CTRL / Command and click on a row or multiple rows to select the switches as illustrated in the following examples. The dashboard displays the selected switches, the number of rows chosen, and the total number of entries.

Multi-Select Feature - Menu
Use the Select All or Clear Selection options, as required.
Right-click in the dashboard and chose the applicable menu options. The feature execution occurs on the selected items.

Multi-Select Feature - Topology Dashboard
In some cases, the right-click function does not apply, and a Submit action may be required as shown below.
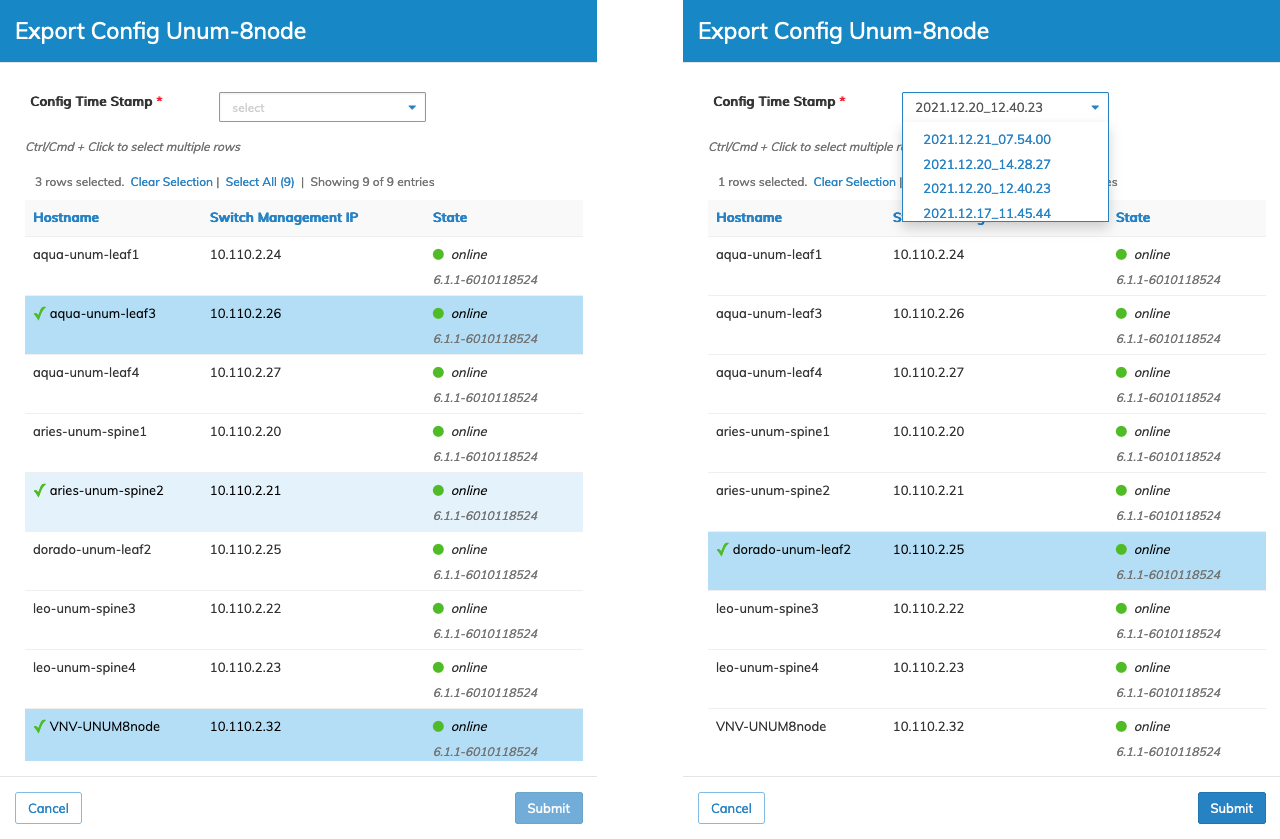
Multi-Select Feature - Export Configuration
Manager Dashboard Example
In this example, the Multi-Select / Select All feature in the All Notifications dashboard activates the Mark Selected As Read button, allowing an action to occur on the selected items.
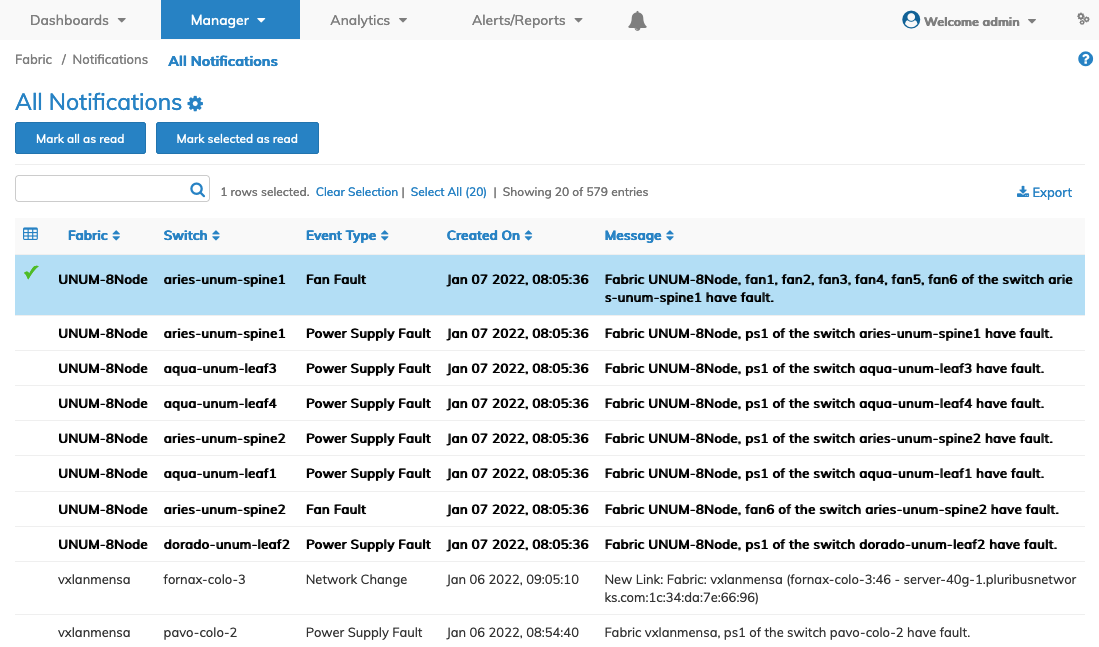
Multi-Select Feature - Manager Dashboard Example
Help Button
NetVisor UNUM provides access to embedded and specific help documentation via the Help Button ![]() icon.
icon.
Notification Bell
The NetVisor UNUM notification bell ![]() displayed on the top navigation bar provides visual feedback and alerts.
displayed on the top navigation bar provides visual feedback and alerts.
Click on the icon to obtain the following information:
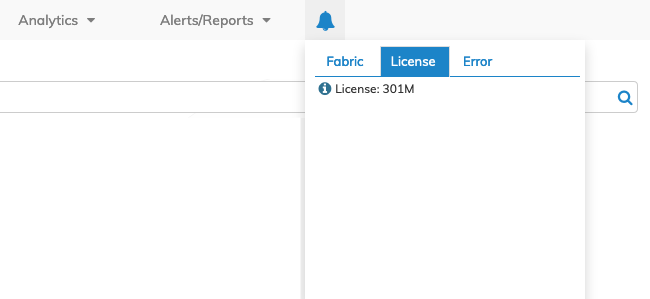
•License Status - selected via the License tab and displays license status.
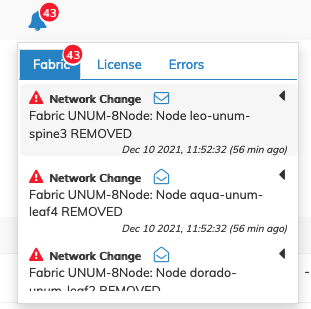
•Fabric Changes & Faults - selected via the Fabric tab and displays messages about fabric issues, includes fan and power supply faults.
•Error - selected via the Error tab and displays recent error messages.
Alert or Alarm conditions are indicated with the ![]() icon and highlight the number of unaddressed alert conditions.
icon and highlight the number of unaddressed alert conditions.
Note: Fabric Resource Group (FRG) users see only the alert messages from their assigned resources. Refer to Manage Groups and Fabric Virtualization for more information on creating and using FRGs.
Note: The Notification Bell displays notifications from the last 15 minutes.
|
|
|
|
NetVisor UNUM Notification Bell License |
NetVisor UNUM Notification Bell Fabric Change |
You use Click to Rediscover to clear the alert in the event of Fabric notification changes and to update the Topology map.
Unread Notifications
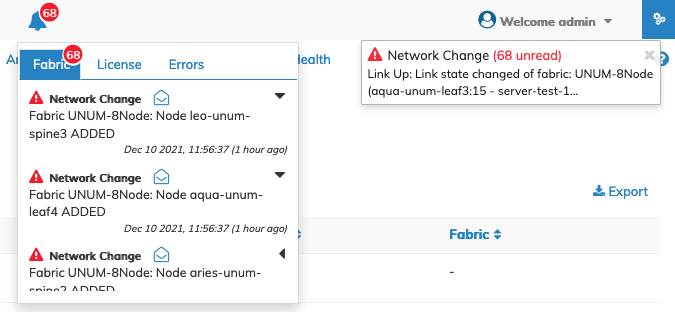
If an alarm condition exists, a visual notification provides you with the number of Unread Notifications.
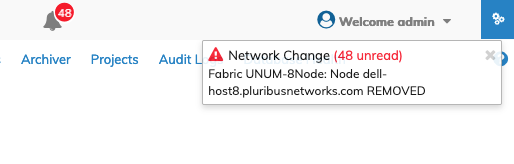
NetVisor UNUM Notification Bell Unread Notifications
After reviewing the alarm notification click the X to close the pop-up window.
Alert or Alarm conditions are indicated with the ![]() icon.
icon.
|
|
|
|
NetVisor UNUM Notification Bell License |
NetVisor UNUM Notification Bell Fabric Change |
Alert Message Toggles
The alert notification ![]() icon indicates an alert condition exists. Click the icon to mark the alert as Read. The alarm notification count updates, and the respective row turns from gray to white.
icon indicates an alert condition exists. Click the icon to mark the alert as Read. The alarm notification count updates, and the respective row turns from gray to white.
Alternatively, you click the ![]() icon to mark the alarm condition as Unread. The alarm notification count updates and the row turns white to gray.
icon to mark the alarm condition as Unread. The alarm notification count updates and the row turns white to gray.
To view longer Alert and Error messages, click the expand ![]() icon. The alarm notification message information expands and displays the entire contents of the message.
icon. The alarm notification message information expands and displays the entire contents of the message.
Click the arrow ![]() icon to return the message to collapse the message. When using the expand icon the message toggles to Read.
icon to return the message to collapse the message. When using the expand icon the message toggles to Read.
When all messages are read, the alarm bell toggles from red to gray to indicate unread alert messages conditions no longer exist.
NetVisor UNUM Notification Alarm Mark as Unread
Notification Snooze Feature
After reading a message, a repeat notification message and pop-up for the same event will not occur. Unread messages continue to receive repeat notifications.
If a notification occurs again for the same event but is previously read, then the notification pop will not display. However, you will see the same notification with an updated timestamp in the Notifications tab.
This applies only to fan, power, license, and cert notifications.
Note: The Topology map and the Fabric Details pane updates automatically when a switch goes down and a notification is received.
The following is an example of a Fabric Network Change pop-up message describing the event and the switch name and port (aqua-unum-leaf3:15).
Note: Fabric Resource Group (FRG) users see only the alert messages from their assigned resources. Refer to Manage Groups and Fabric Virtualization for more information on creating and using FRGs.
NetVisor UNUM Dashboard Alarm Notification Message Example
In the event of a License alert, remove the visual alarm condition by activating a license.
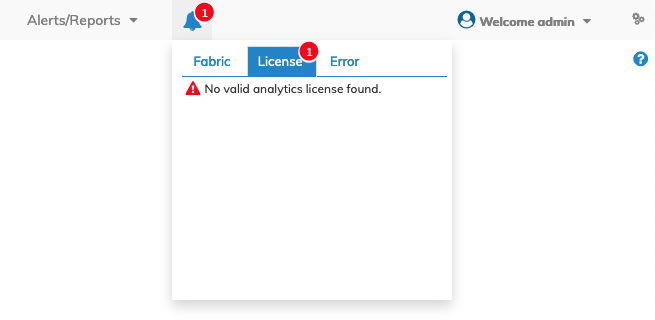
NetVisor UNUM Dashboard Alarm Notification License Error Message Example
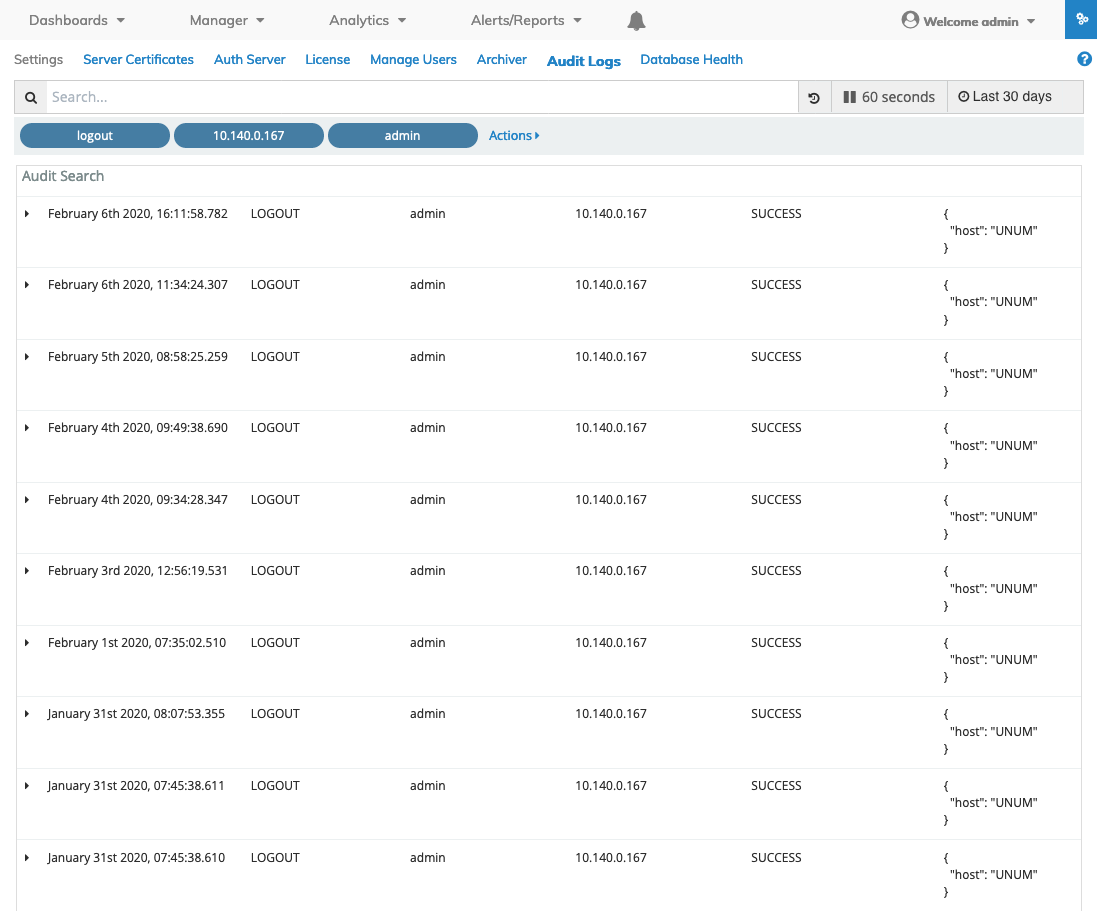
In the event of an Error alert, review and read individual error messages by selecting the Error tab.
Mark messages as Read, Unread or Delete the messages as required using the respective ![]() ,
, ![]() or
or ![]() icons.
icons.
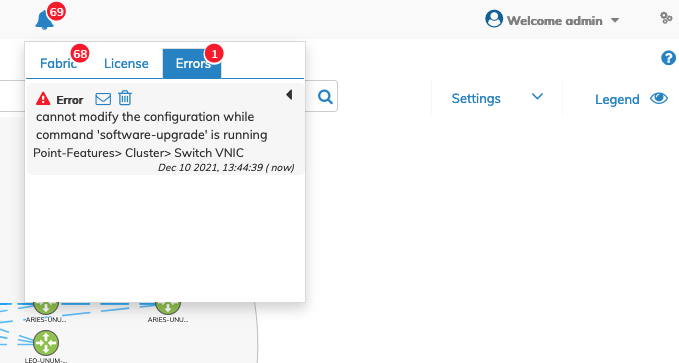
NetVisor UNUM Dashboard Alarm Error Notification Message Example
Note: The Error tab displays any errors over the past 15 minutes. To view older error messages, use the Audit Logs dashboard.
Note: Fabric Resource Group (FRG) users see only the alert messages from their assigned resources. Refer to Manage Groups and Fabric Virtualization for more information on creating and using FRGs.
Function Cog
The Function Cog ![]() icon allows you to perform various functions within the dashboard including, Modify, Edit, Delete, or Trigger an Action depending on the specific feature.
icon allows you to perform various functions within the dashboard including, Modify, Edit, Delete, or Trigger an Action depending on the specific feature.
Edit Icon
Use the Edit icon to make changes to settings, parameters and ports, for example in the Interactive Port Selector.
Customize View
Display or hide individual columns using the Customize Dashboard ![]() icon selecting or deselecting the Attribute column from the drop-down list.
icon selecting or deselecting the Attribute column from the drop-down list.
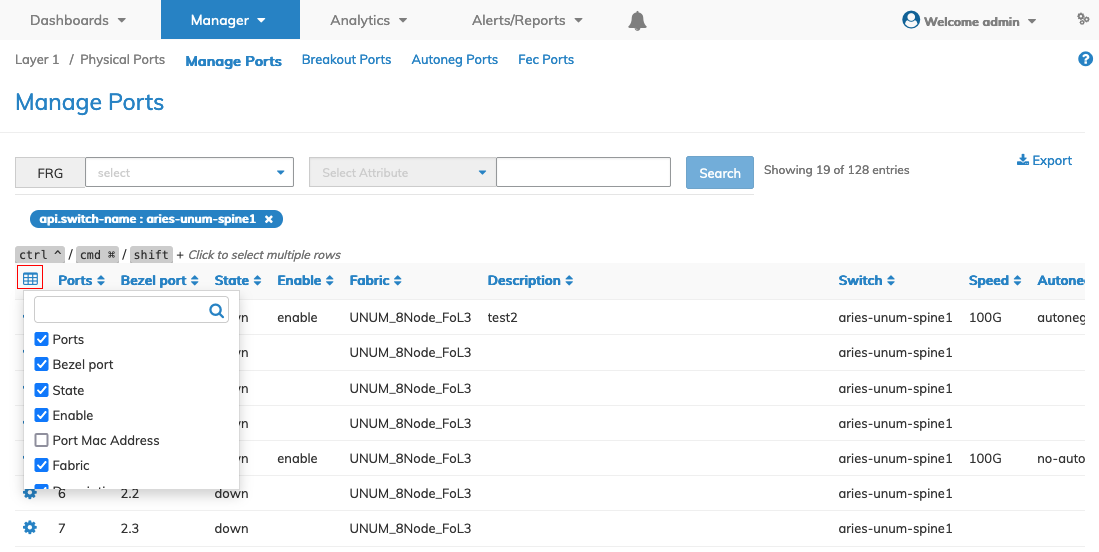
NetVisor UNUM Common Features - Customize Table Selector
To quickly find an Attribute column in longer lists, use the Search feature.
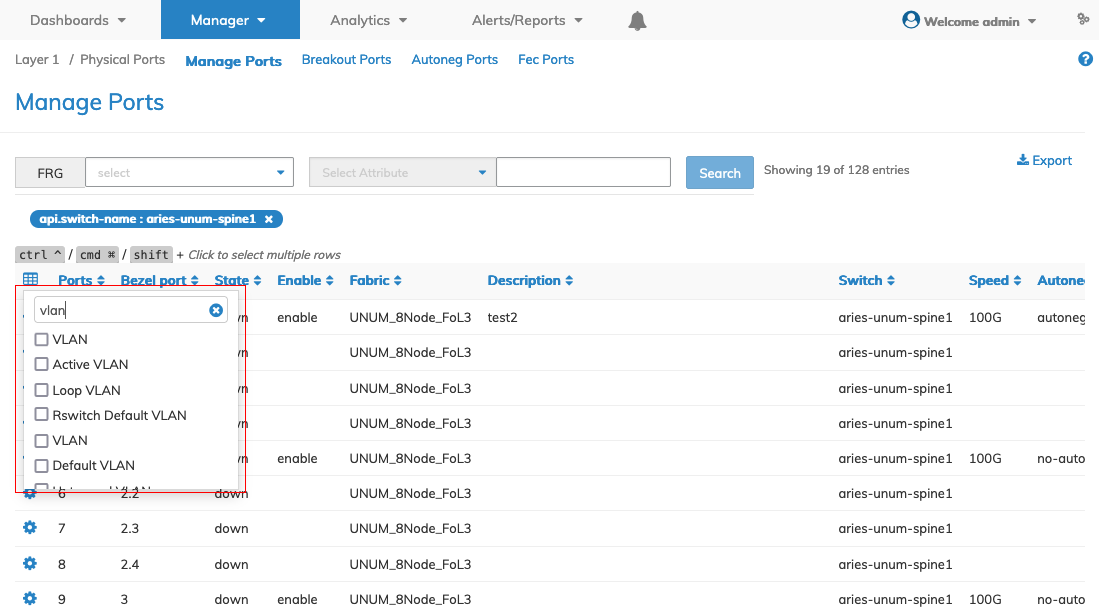
NetVisor UNUM Common Features - Customize Table Selector - Search Attribute Column
Use the mouse in a drag and drop manner to rearrange columns. Select the applicable column and move it to the new location.
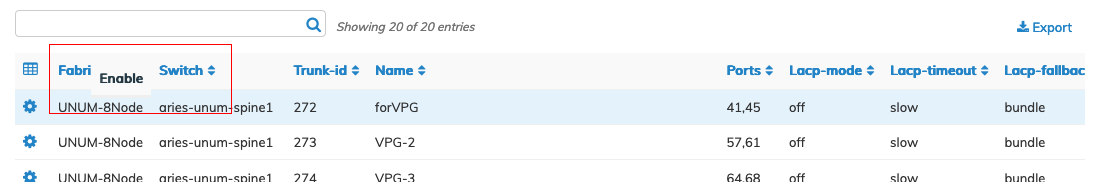
NetVisor UNUM Common Features - Drag and Drop Column Organizer - Example
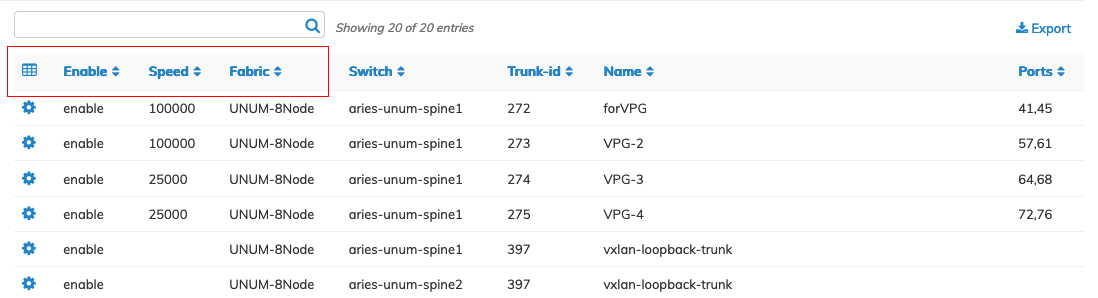
NetVisor UNUM Common Features - Drag and Drop Column Organizer
Sorting Columns
Sort the list of entries in a dashboard using the up / down ![]() arrows in column, as required.
arrows in column, as required.
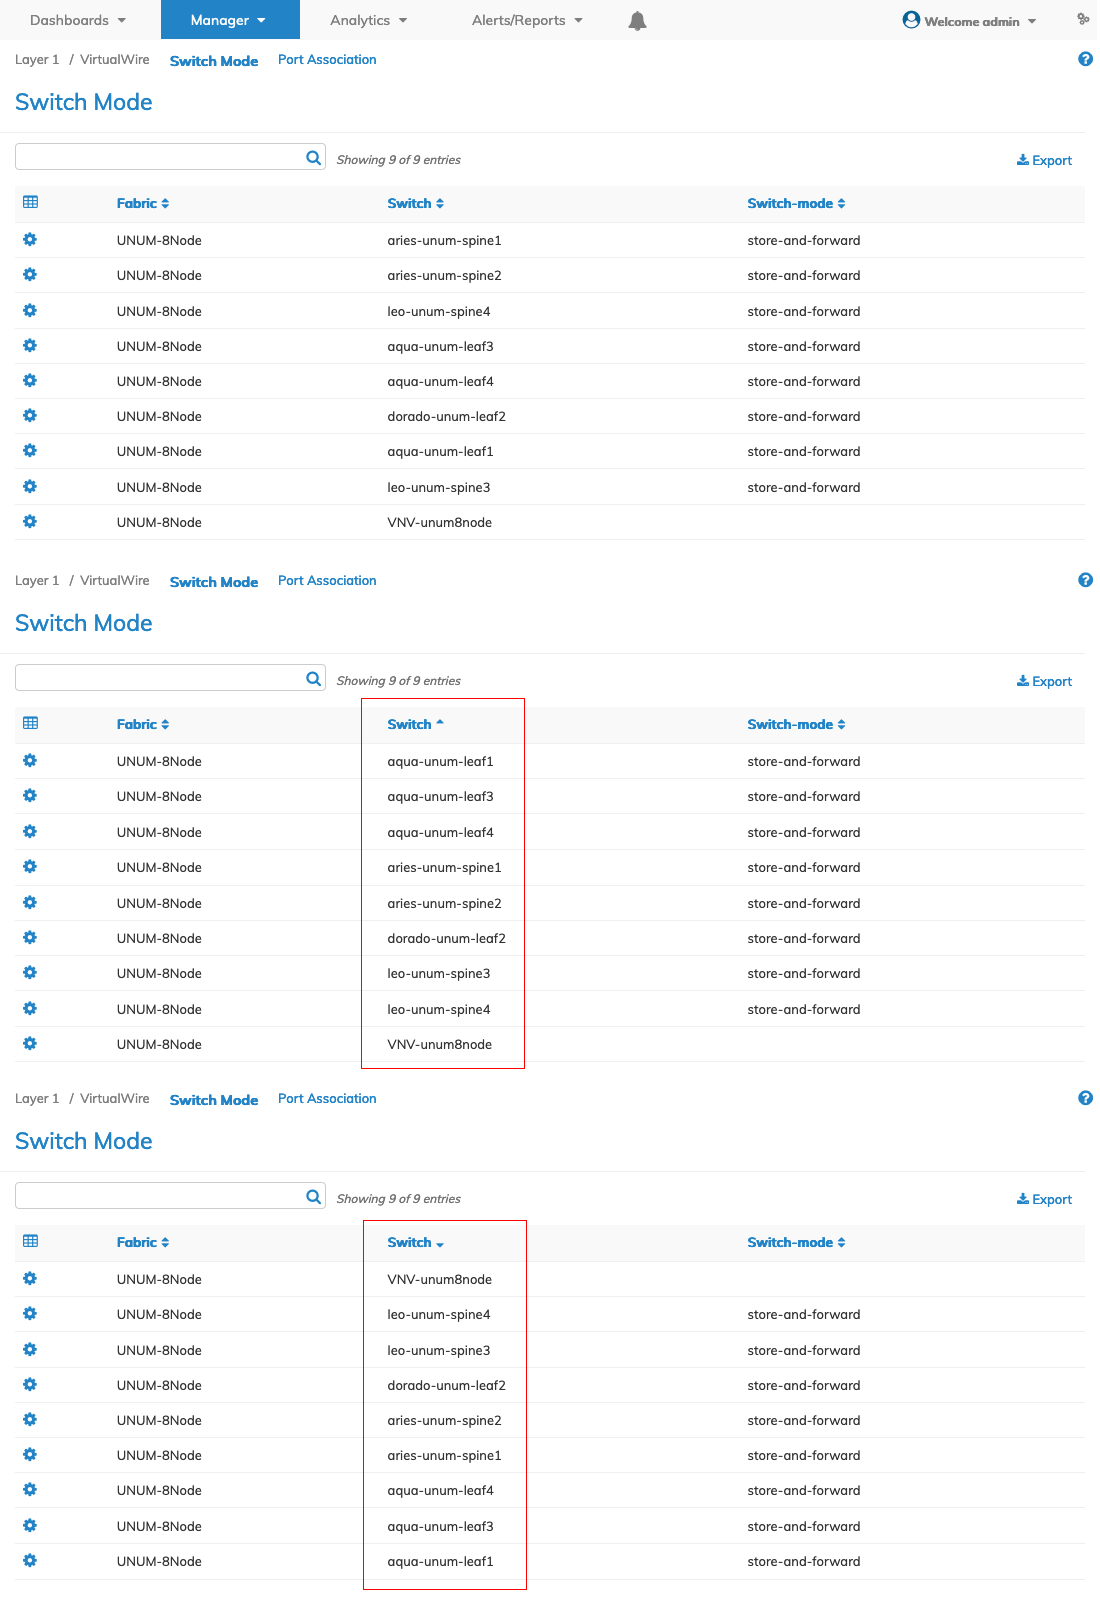
NetVisor UNUM Common Features - Customize Table Selector
Blank Columns
In some instances, a dashboard may not display some information in a column.
This display condition is typically due to the information scope focus, for example, a scope being Fabric, Switch, or Cluster.
A Switch column may be blank when the feature uses a Fabric scope, as illustrated in the following example.
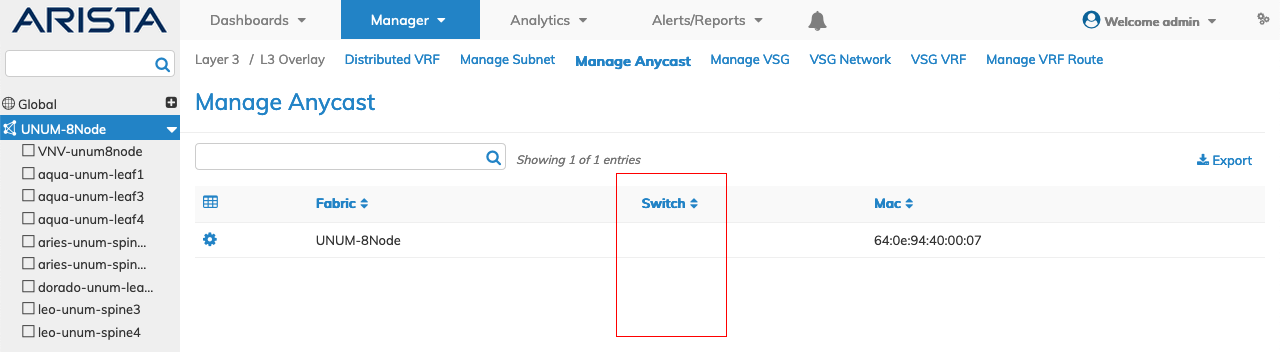
NetVisor UNUM Common Features - Empty Column Example
Details Pane
Usage Note: There is not an icon associated with this function. To obtain detailed information about a dashboard item click on an entry in a dashboard.
Click on an entry in the dashboard to obtain detailed information about a dashboard item.
A Details pane opens displaying the configuration information about the item.
Click X to close the viewing pane.
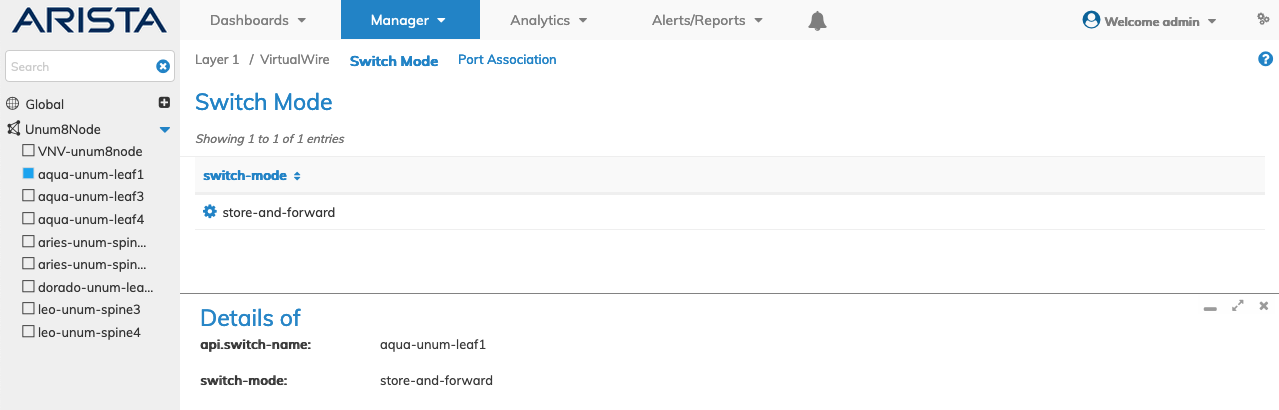
NetVisor UNUM Common Features - Details Pane
The following is an example of the Details pane obtained by choosing a switch from the Manage Transactions dashboard.
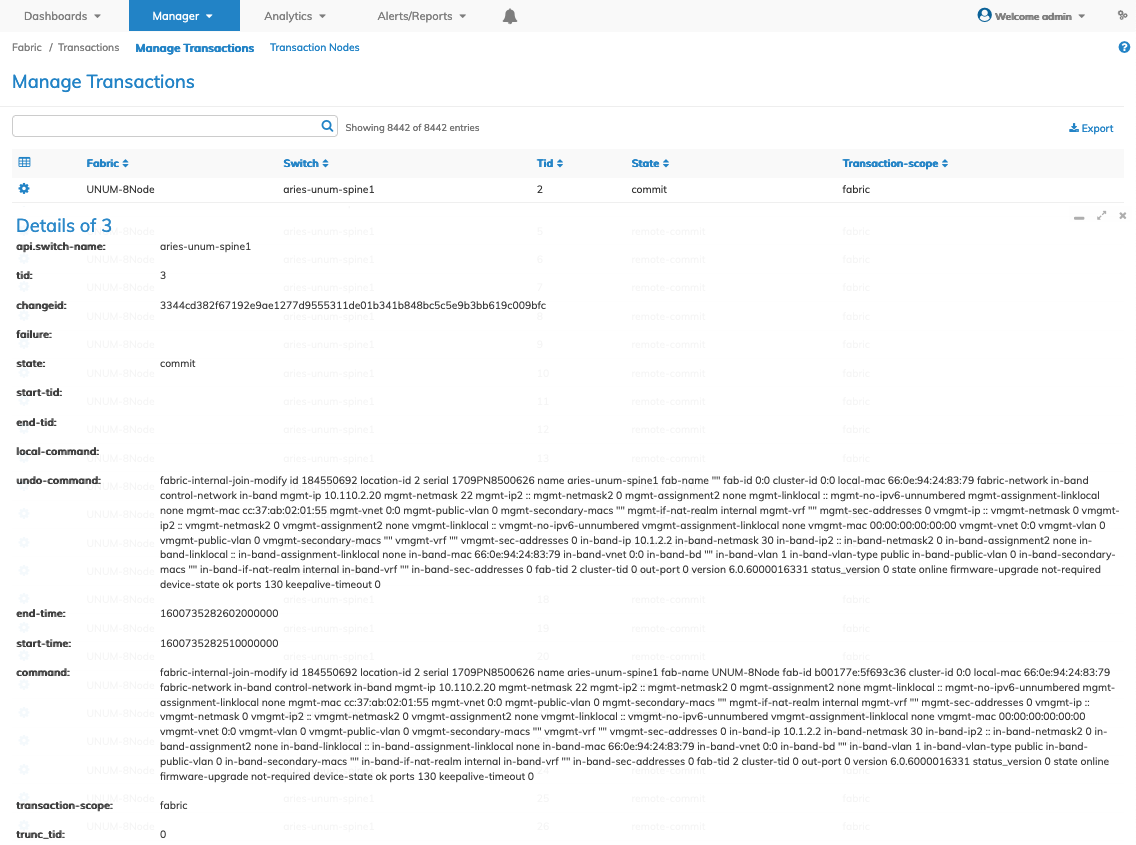
NetVisor UNUM Common Features - Details Pane Example
Export Data
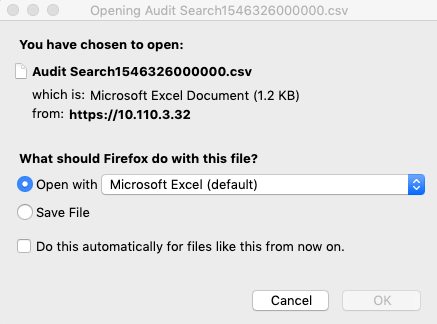
Click on the Export ![]() icon to export data to a CSV file. You have the option to Open or Save the File.
icon to export data to a CSV file. You have the option to Open or Save the File.
Note: In some instances, a pop-up message appears indicating a large number of records exist. You have the option to export the data or cancel the process. The message occurs when the number of records exceeds 100,000. Data exports of less than 100,000 records automatically process.
Search Pane Export Data Example
Examples of a PortStats data export with Summary Raw and Formatted versions.
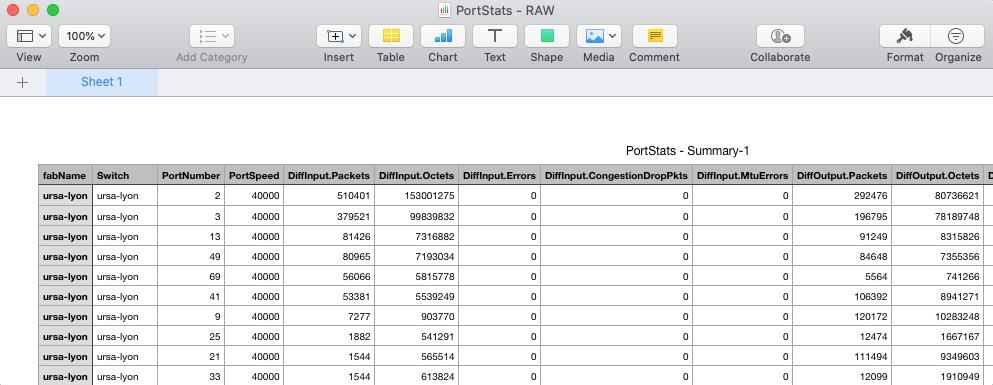
Switch Analytics Port Stats Summary Raw Data Export Example

Switch Analytics Port Stats Summary Formatted Data Export Example
Interactive Port Selector
The Interactive Port Selector widget displays a grid accurately representing switch port availability and shows the number of physical ports on a given switch.
Gray depicts down ports and white, up ports. Selected ports appear in blue. When rolling over a disabled port, a "disabled" tooltip appears.
Click the Edit icon to display and select a range of ports. Click the applicable ports and click Apply to continue or Cancel to return to the previous screen without applying any changes.
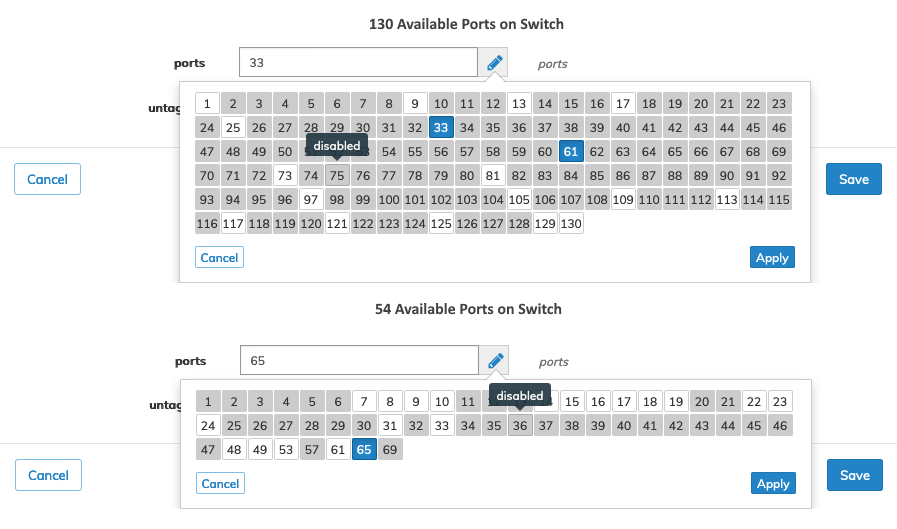
Manager Layer 1 VirtualWire Port Association Interactive Port Selector
Click Save to continue or Cancel to return to the previous screen without saving any changes.
Search & Filtering - Incremental Search
While the Search feature is sometimes described separately in sections of the documentation, the following provides a general overview as to the Search & Filtering function used throughout the Analytics areas of NetVisor UNUM.
Dashboard Search & Filtering
Many of the NetVisor UNUM dashboards contain a search feature.
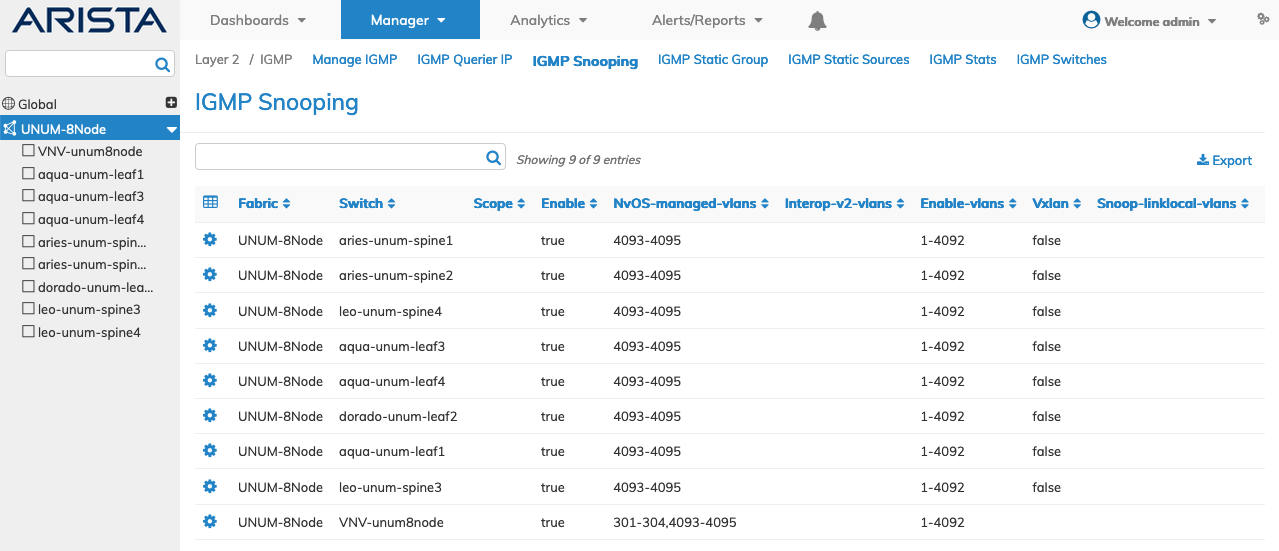
Dashboard Search and Filtering
In the following example, IGMP Snooping, entering a value in the search window, automatically updates the dashboard with the filtered results.
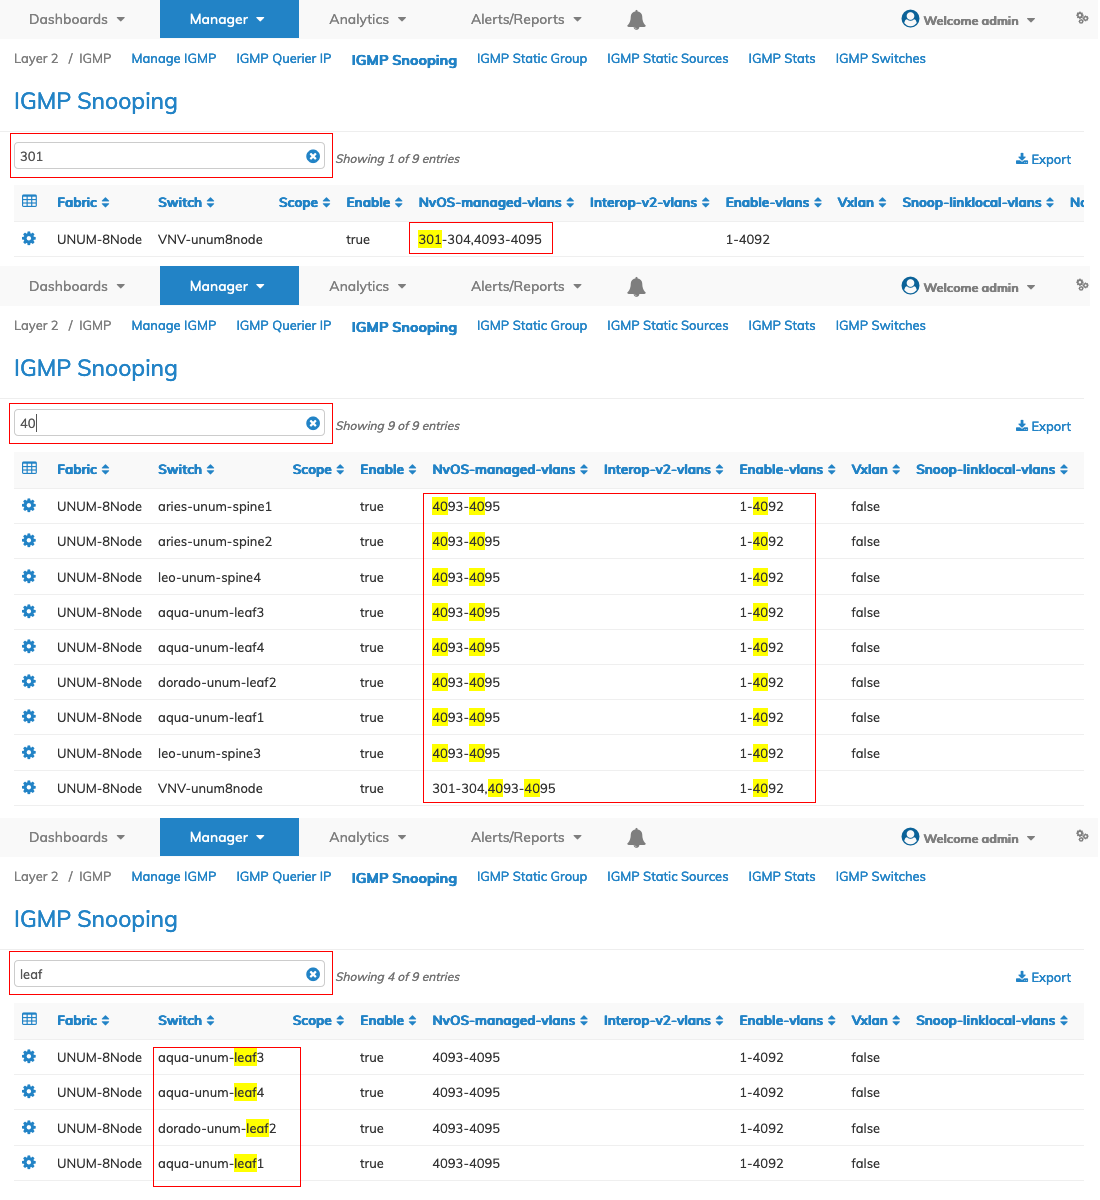
Dashboard Search and Filtering - Examples
Analytics Search & Filtering
While the Search feature is sometimes described separately in sections of the documentation, the following provides a general overview as to the Search & Filtering function used throughout the Analytics areas of NetVisor UNUM.
The Search box function provides a useful method of searching for connections related information using an auto-populate feature based on previous searches.
Example: You begin by entering an IP address, e.g., 10.9.. A drop-down list appears highlighting the search criteria along with source and destination IP addresses.
Select the entry by clicking the applicable IP address in the drop-down list, and the information is auto-populated in the search box.
Clicking on the applicable IP address initiates the search.
The related information shown in the graphical interface updates with data from the search criteria and highlights the filter information in the filter bar.
Multiple searches populate the filter bar. Source and destination search criteria, when entered, is displayed in new filter bars.
You also search using the IP address and the /XX netmask format.
Enable a Filter Actions drop-down menu by clicking the arrow and a list of available filters selected to refine the search results.
The Search box feature is present throughout many of the NetVisor UNUM dashboards and its use similarly for each. The same is true for most Filter functions.
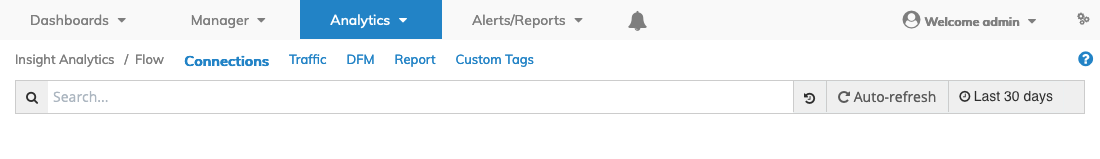
Search Box Example
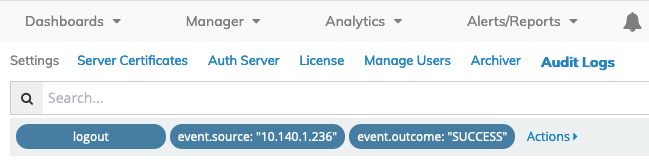
Filter Actions Example
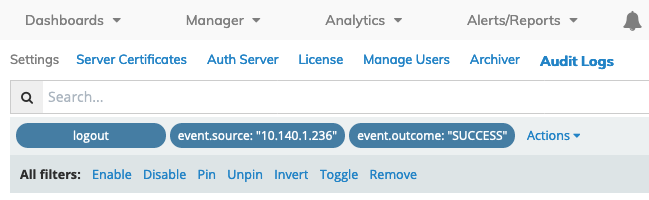
Filter Actions Selected Example
All Filters:
•Enable – Enables the designated filter
•Disable – Disables the designated filter
•Pin – Pins the designated filter to the Dashboard interface
•Unpin – Unpins the designated filter from the Dashboard interface
•Invert – Invert the designated filter
•Toggle – Switch between filters
•Remove – Removes the designated filter from the Dashboard interface
The designated filter highlights in the filter bar shown in the figure.

Filter Actions Rollover Example
Moving the mouse over the filter bar reveals an editing menu providing additional functionality including a query editor as shown in the figure below.
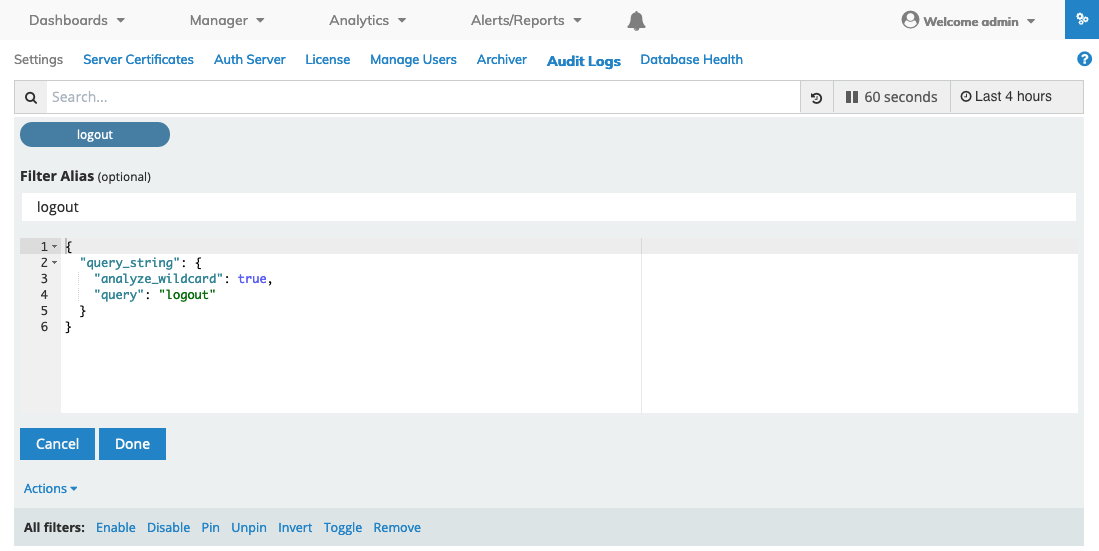
Query Editor Example
Retrieve Search history by selecting the Clock Arrow.
Clear prior search history criteria by clicking on Clear History as shown below in the figure below.
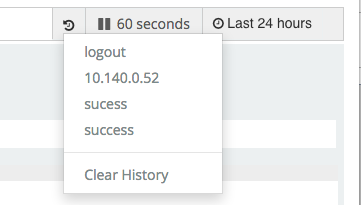
Search Prior History Example
The information displayed is updated based on the selected sampling time by clicking on the Time link from 5 seconds to 24 hours.
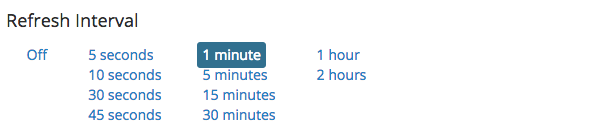
Time Link Example
Data collection is stopped using the ![]() (Pause) icon and restarted using the
(Pause) icon and restarted using the ![]() (Play) icon.
(Play) icon.
Alternately, turn off updates as applicable.
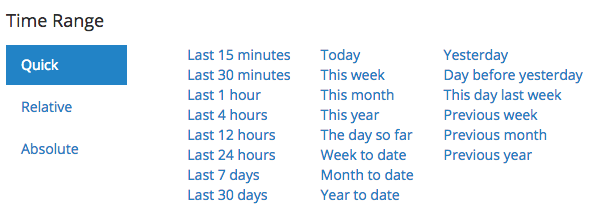
Historical information is displayed by clicking on the Last (time) icon and can display information from current day up to the last 5 years.
The updated time sampling and historical selection is displayed in the tool bar.
Quick, Relative and Absolute time drill-down monitoring is achieved by selecting the appropriate icon. The Quick method displays data from current day up to the previous year.
Time Range with Top Talkers Example
In some cases, the Time Range selection will not include Top Talkers as illustrated below.
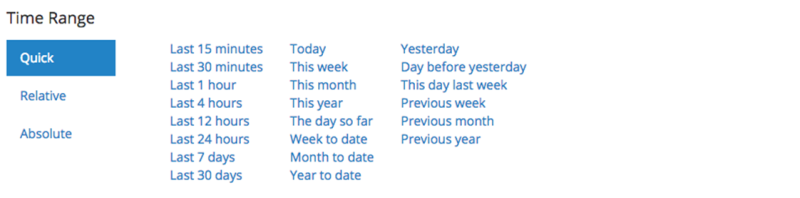
Time Range - Quick Mode - Example
The Relative and Absolute methods provide an expanded and finer level of granularity for selecting data from specific date ranges as illustrated below.
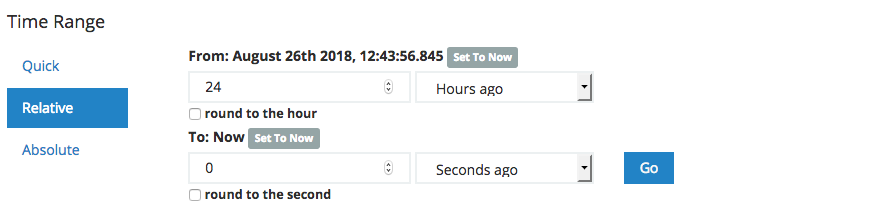
Time Range - Relative Mode - Example
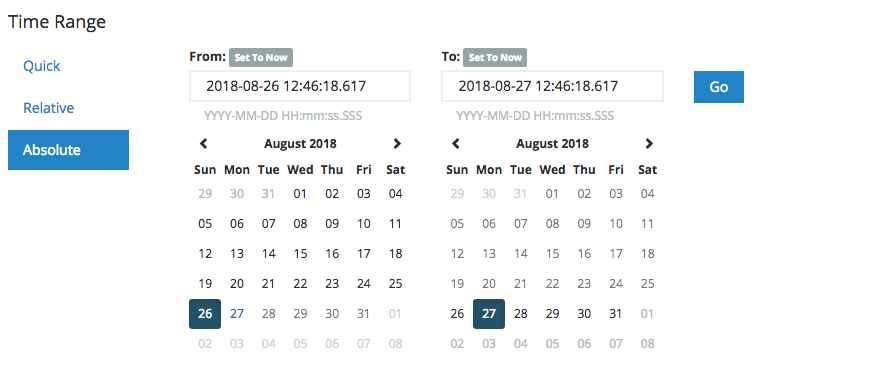
Time Range - Absolute - Example
Search Details Table
The Search pane provides extensive details regarding the information displayed in the dashboard.
Search Pane Details Example
Data Filtering
Rolling over a column in any given Details section reveals a ![]() icon used to Add or Remove filters from the search criteria.
icon used to Add or Remove filters from the search criteria.
Clicking on the ![]() icon in the Details section reveals Tabular and JSON data.
icon in the Details section reveals Tabular and JSON data.
You display more detailed information by clicking the ![]() arrowhead icon. Table data is displayed along with JSON script.
arrowhead icon. Table data is displayed along with JSON script.
The details are displayed in two tabs:
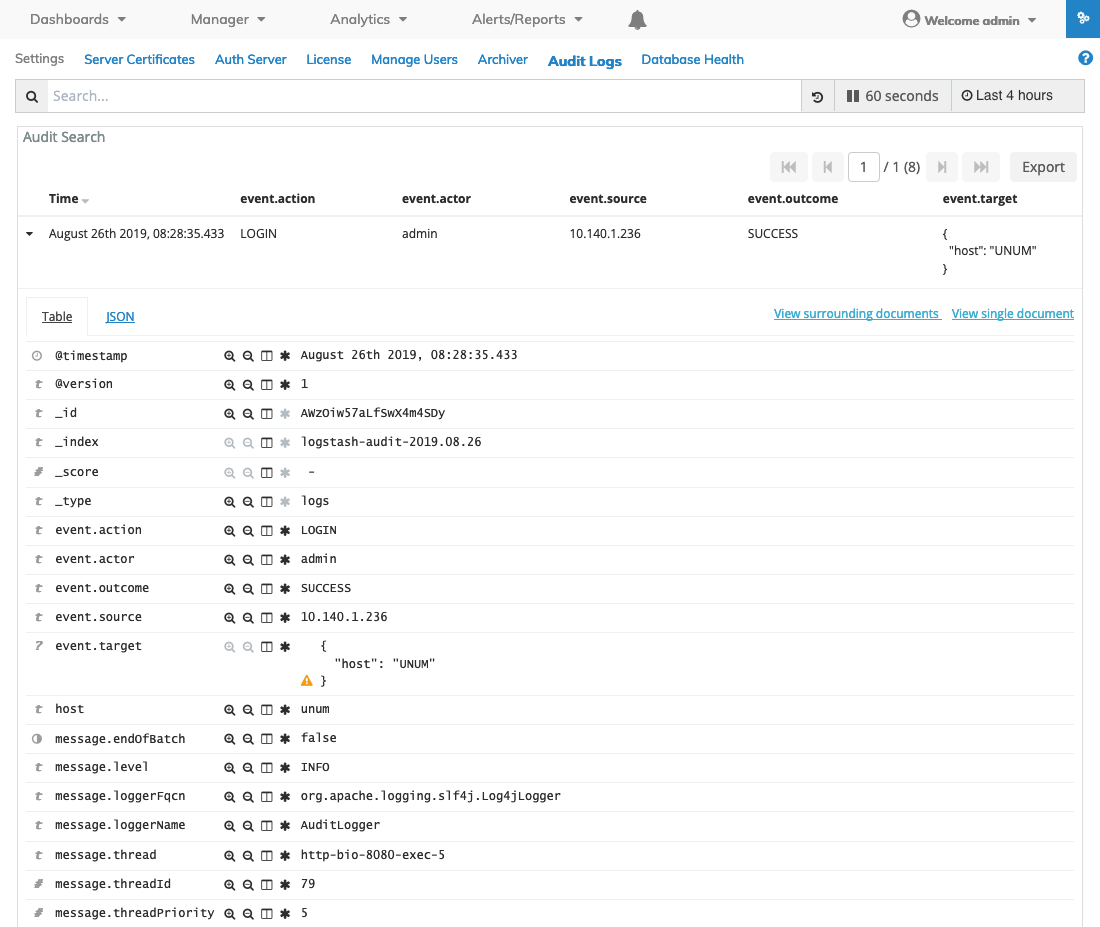
Search Pane Table Data Example
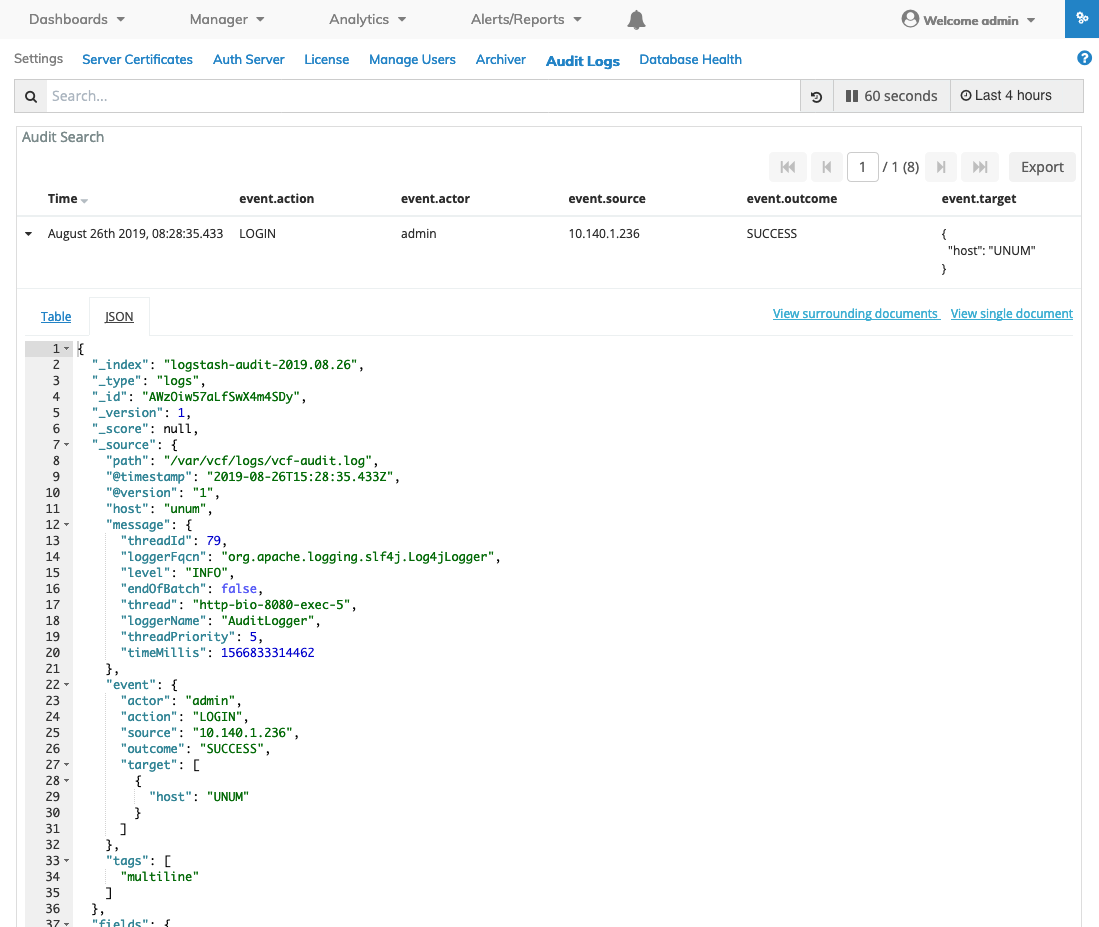
Search Pane JSON Data Example
Using NetVisor UNUM Insight Analytics Flow Search Features
NetVisor UNUM Insight Analytics Flow provides a powerful search engine with a simple query syntax designed to isolate and filter specific flows among millions in a fraction of a second.
It has the following features:
•Powerful query syntax to filter flow metadata information based on: field-based exact matches, regular expressions, ranges, Boolean operators.
•Selected views from the Connection Dashboard.
•IP Geo-location for Client and Servers, with custom extension to place on map devices across a large private network.
•Aggregated flow stats: duration, latency, total bytes per connection.
•Extensive “time machine” with absolute or relative year -month-day-hour-minute-second granularity.
•Detailed flow table consisting of over 30 metadata fields associated with each flow.
The NetVisor UNUM Insight Analytics Flow Search page allows you to search the database using custom text queries.
You enter the text query in the search field, and then click the magnifying glass icon to execute the query.
When data is available, the Search dashboard updates and the records matching the query are displayed in the lower section of the search page.
Queries may be executed on any combination of following fields (case sensitive):
|
Field Name |
Example 1 |
Notes |
|
vnet:<string> |
vnet:"prod" |
|
|
vlan:<number> |
vlan:24 |
|
|
vxlan:<number> |
vxlan:1000 |
|
|
switchName:<name> |
switchName:"eta" |
|
|
srcSwitchPort:<number> |
srcSwitchPort:40 |
|
|
dstSwitchPort:<number> |
dstSwitchPort:46 |
|
|
etherType:<number> |
etherType:2048 |
IPv4 |
|
srcMac:<string> |
srcMac:"4c:8d:79:eb:95:c2" |
|
|
dstMac:<string> |
dstMac:"00:00:5e:00:01:0a" |
|
|
srcIp:<string> |
srcIp:"10.20.100.100" |
|
|
dstIp:<string> |
dstIp:"216.58.192.34" |
|
|
app:<string> |
app:"https" app:"ftp-control" |
Also dstPort:<number> as in dstPort: [20 TO 21] |
|
dscp:<number> |
dscp:0 |
|
|
proto:<number> |
proto:6 |
TCP |
|
curState:<string> |
curState:"SYN" |
Also "FIN", "EST", "RST" |
|
dur:<number> |
dur:50 |
|
|
latency:<number> |
latency:1000000 |
Time is in microseconds |
|
startedTimeStr:<string> |
startedTimeStr:"1456346059000" |
Unix time 1456346059 = Wed, 24 Feb 2016 20:34:19 GMT (*) |
|
endedTimeStr:<string> |
endedTimeStr:"1456346159000" |
Unix time 1456346159 = Wed, 24 Feb 2016 20:35:59 GMT (*) |
|
throughput:<number> |
throughput:4.5 |
|
|
ibytes:<number> |
ibytes:0 |
|
|
obytes:<number> |
obytes:1000 |
|
|
totalBytes:<number> |
totalBytes:5000000 |
|
|
age:<number> |
age:7 |
|
|
fabricName:<string> |
fabricName:"prod" |
|
Insight Analytics Flow Search - Search Fields
On the Search page, you query a specific subset of transactions from the selected time period. The syntax for the query allows field filtering, wildcards, and Boolean operators. For example, to search for HTTP redirects, use the syntax:
http AND http.code: 302.
String Queries
A query may consist of one or more words or a phrase.
A phrase is a group of words surrounded by quotation marks, such as “test search”.
To search for all HTTP requests to a specific domain, use “mydomain.com” in the search field.
Note: To search for an exact string, you need to wrap the string in double quotation marks. Without quotation marks, the search in the example matches any documents containing any of the words my, domain, or com.
Field-based Queries
You also search for specific fields in the database. To view HTTP transactions, for example, use the query:
type: http.
Regexp Queries
The Search page also supports regular expressions for filters and expressions. For example, to search for all HTTP responses with JSON as the returned value type, use the query:
http.content_type: *json.
Boolean Queries
Boolean operators such as AND, NOT, and OR, allow you to combine multiple sub-queries through logic operators.
Note: All Operators must be capitalized such as AND, OR, and NOT.
To search for all VLANs except VLAN 0, use the query NOT vlan: 0.
Parentheses are also supported to group sub-queries. To search for all apps connected on Friday with latency of 10, use the following query:
(app: http AND dayOfweek: 6-Fri) AND latency: [0 TO *]
The text query follows a simple syntax as in the following examples:
|
Data Query Syntax |
Explanation |
|
* |
wildcard to select everything, or to indicate "from" any value, or "up to" any value |
|
NOT vlan:24 |
Exclude VLAN id 24 |
|
srcSwitchPort:[40 TO 45] |
Include input port 40 to 45 |
|
dstSwitchPort:{9 to 16} |
Include output port 10 to 15 |
|
srcSwitchPort:[10 TO 20] AND dstSwitchPort: {9 TO 16} |
Input port 10 to 20 and output port 10 to 15 |
|
srcSwitchPort:[10 TO 20] OR dstSwitchPort: {9 TO 16} |
Input port 10 to 20 or output port 10 to 15 |
|
srcHostname: "fc-w550s" AND app: "ssh" |
Connections from host fc-w550s using ssh |
|
startedTimeStr: "1456346059000" TO "1456346159000" |
Connections between Wed, 24 Feb 2016 20:34:19 GMT and Wed, 24 Feb 2016 20:35:59 GMT |
|
NOT startedTimeStr: "1456346059000" TO "1456346159000" |
Exclude the connections in same interval |
|
app:"ssh" AND NOT startedTimeStr: "1456346059000" TO "1456346159000" |
Connections using ssh outside given interval |
|
latency:[1000000 TO *] AND app:"LDAP" |
Connections to LDAP server that took 1 second or more to be established |
|
totalBytes:[5000000 TO *] |
Connection with 5 Million bytes data transfer or more |
Insight Analytics Flow Search Syntax Examples
Note: All syntax above is case sensitive.
Advanced Search
By default, and when selecting Fabric, the Seed Switch displays in the dashboard as illustrated below.
Advanced Search -Seed Switch - Default Dashboard - Fabric Selected
The Advanced Search function provides a rapid method to search across Fabric Manager, Fabric Resource Groups and feature Attributes.
An incremental search option is supported when no FRG or Attribute is selected.
Advanced Search - Fabric / Switch / FRG Matrix
|
Action |
FRG (Fabric Resource Group) |
Attribute |
Result |
|
Select a Fabric from Left-hand Navigation Pane |
Selected |
None |
All data from the FRG including cross Fabric data returned. |
|
Select a Switch from Left-hand Navigation Pane |
Selected |
None |
Only data matching the selected switch returned. |
|
Select a Fabric from Left-hand Navigation Pane |
Selected |
Switch (switch is part of the FRG) |
Only data matching the selected switch returned. |
|
Select a Fabric from Left-hand Navigation Pane |
Selected |
Switch (switch is not part of the FRG) |
Error message displays. Switch filter ignored and all data from the FRG returned. |
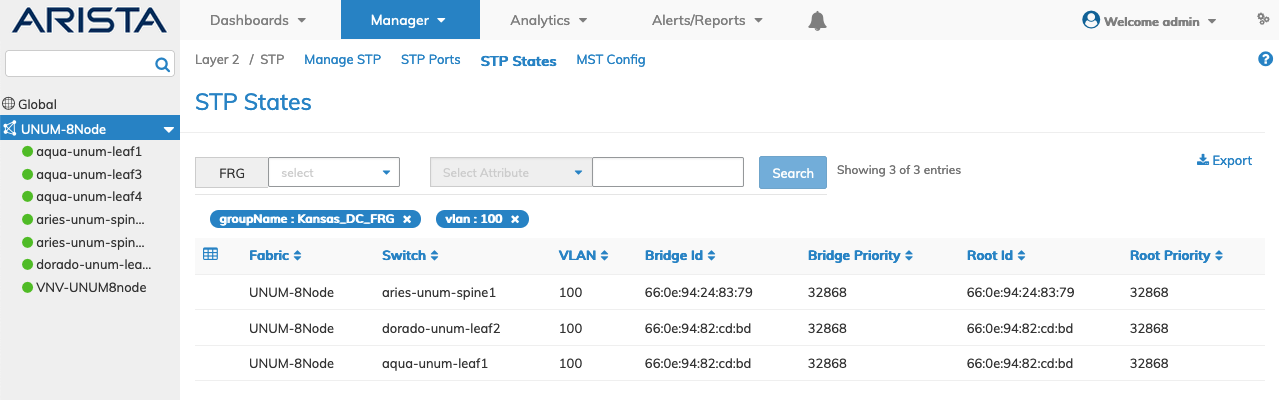
Feature Attributes
A feature's attributes may be short or extensive as illustrated in the following examples.
STP States Attributes
|
Fabric |
Switch |
VLAN |
Bridge ID |
Bridge Priority |
Root ID |
|
Root Priority |
|
|
|
|
|
Manage Ports Attributes
|
Switch |
Ports |
Bezel Port |
Description |
Enable |
State |
|
Port MAC Address |
Speed |
Ethernet Mode |
VLAN |
Active VLAN |
Trunk |
|
Jumbo |
Auto Negotiate |
Routing |
Loopback |
LLDP |
Config |
|
Egress Rate Limit |
LACP Priority |
Edge Switch |
VXLAN Termination |
Send Port |
Loop VLAN |
|
Host Enable |
CRC Check |
DSCP Map |
Local Switching |
Interface |
Bandwidth Bps |
|
STP Port Cost |
STP Port Priority |
Reflect |
Pause |
Receive Only |
Lport |
|
Rswitch |
Rswitch IP |
Rswitch MAC |
Remote Rswitch Port MAC |
Rswitch Default VLAN |
Rport |
|
Up / Down Time |
In Use |
Cluster Port |
Defer Bringup |
Allowed Tpid |
Rhost |
|
Fabric Guard |
FEC |
Status |
Switch ID |
IP |
MAC |
|
vNET |
Bridge Domain (BD) |
VLAN |
VXLAN |
Hostname |
Last Seen |
|
Remote IP |
Remote MAC |
Recover Time |
Err Bpduguard |
Err MAC Limit |
Hide Connections |
|
Link Detail |
Mode |
Max Frame |
Default VLAN |
Dfe Coarse |
Dfe Fine |
|
Dfe Mode |
Learning |
Ports |
Untagged VLAN |
|
|
Advanced Search - Attributes Example
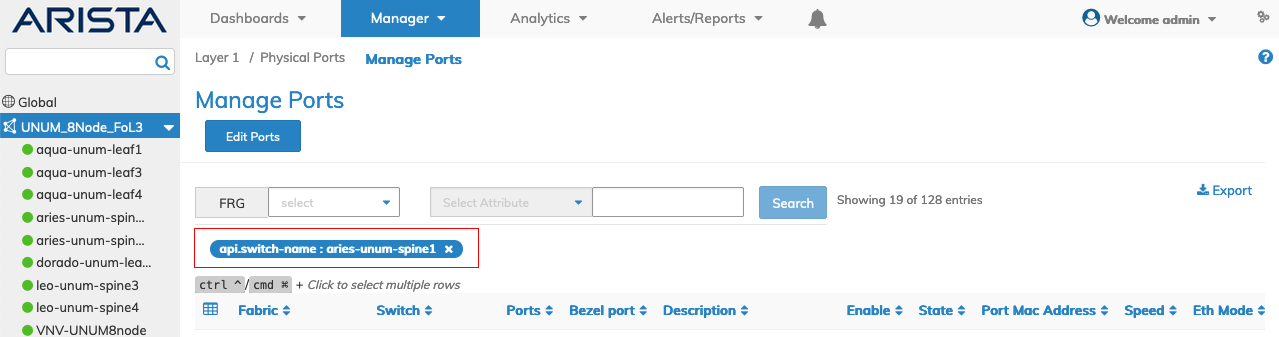
Select the FRG (Fabric Resource Group), or an Attribute and enter the search criteria. The Search button activates.
Click the Search button.
The filtered search criteria appear in the dashboard along with the returned results.
Advanced Search - Filters and Returned Results
Further refinements to the search criteria build new filters as shown in the following Manage Ports example.
An FRG with Attributes, speed, state and the respective search criteria 40G and Up returns the results and updates the filters.
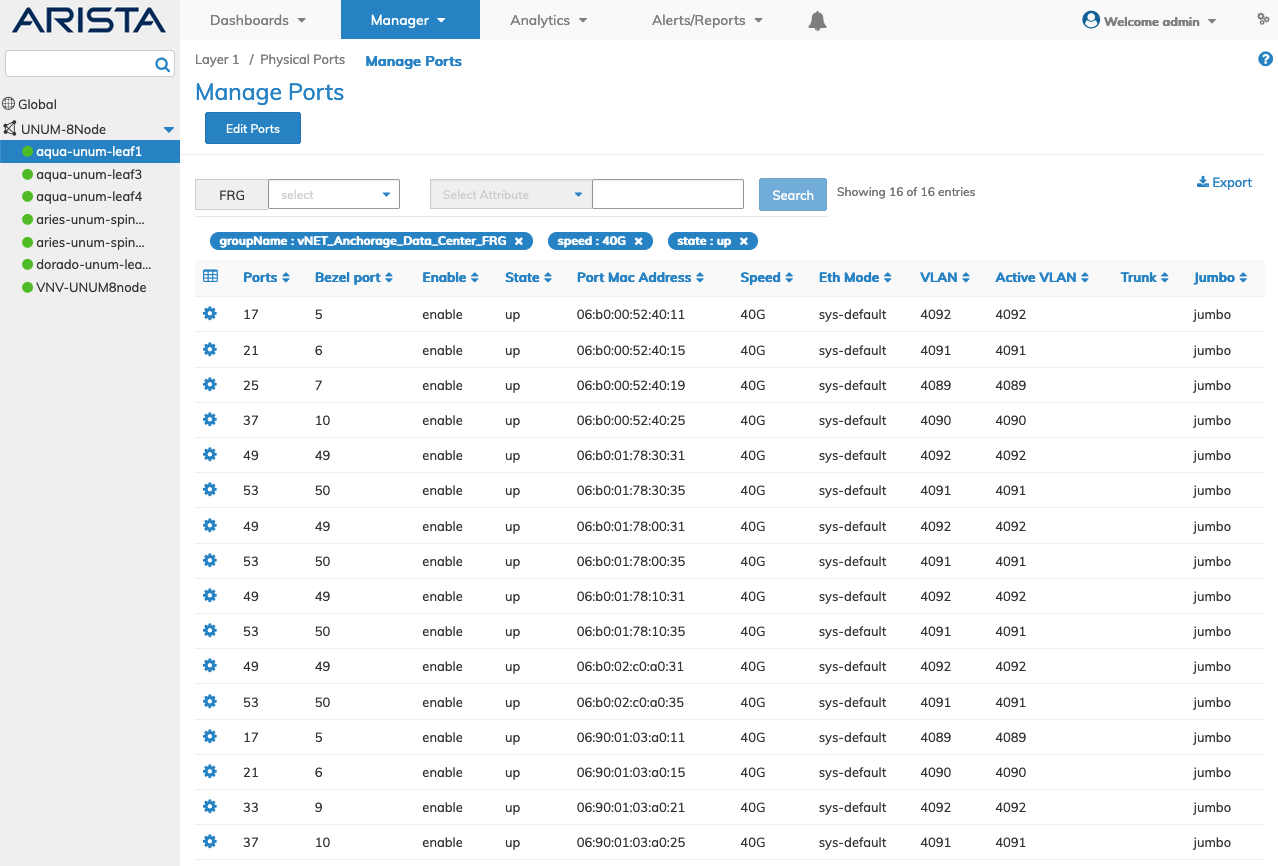
Advanced Search - Additional Filters and Returned Results
Note: An FRG must exist before being selectable in the FRG selection box. Refer to Manage Groups and Fabric Virtualization for more information on creating and using FRGs.
Incremental Search
Select a switch and without selecting an FRG or Attribute, begin typing in the search bar. Matching results auto-updates the dashboard, as illustrated in the following example.
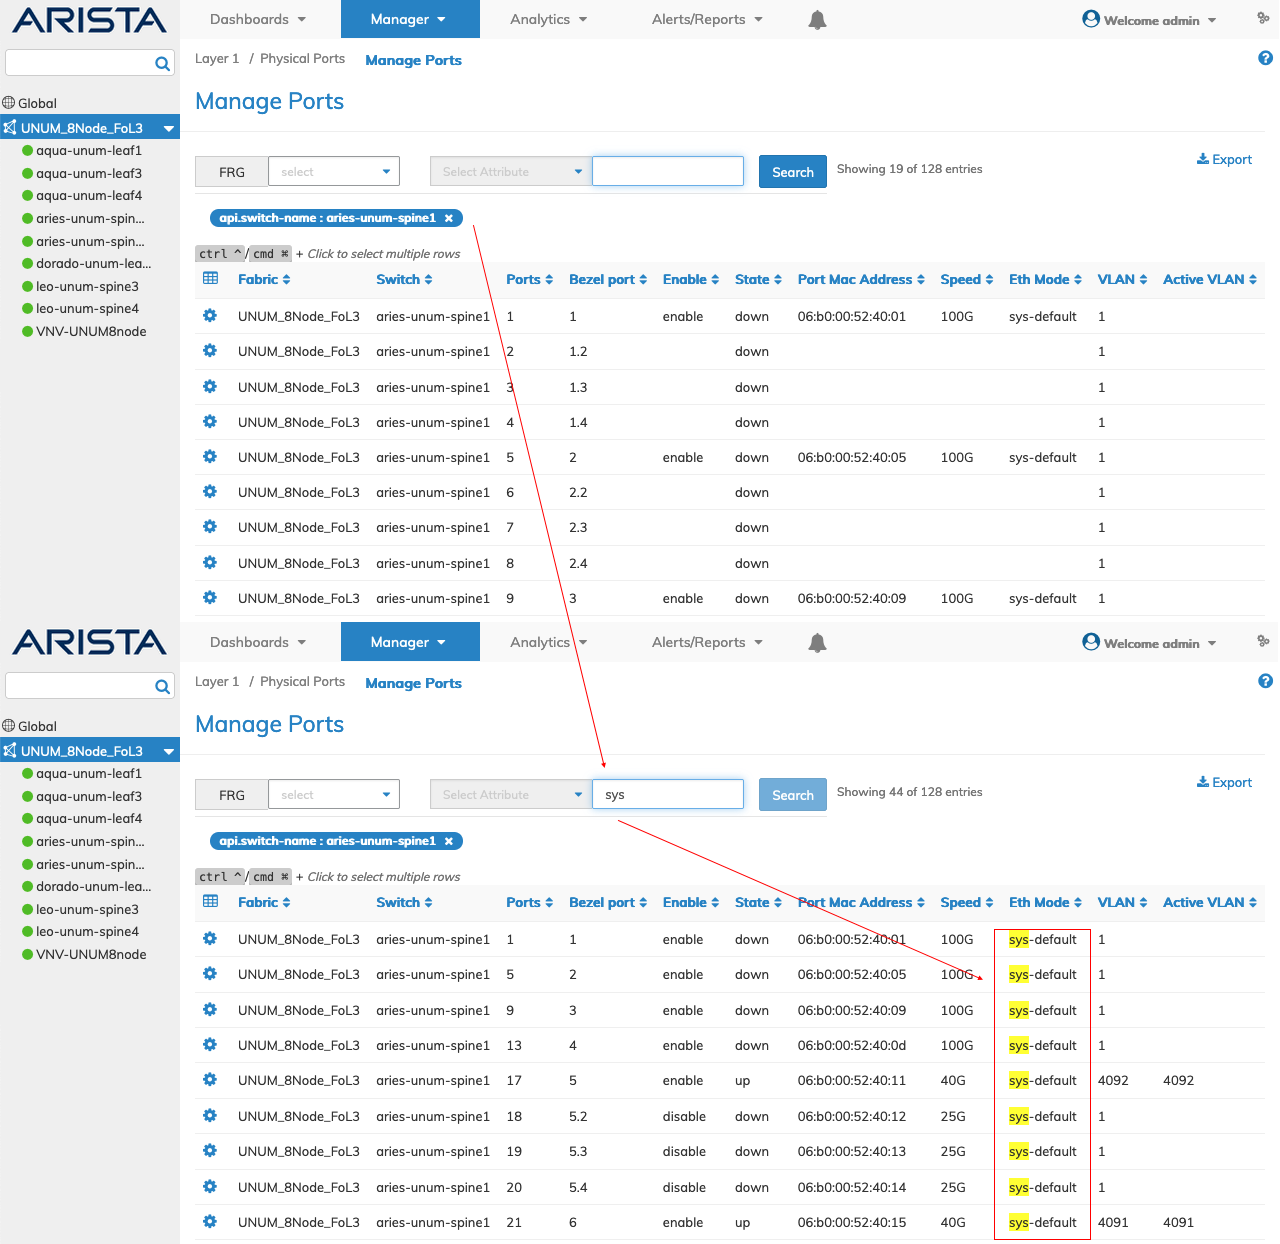
Advanced Search - Incremental Search