
Connectivity Stats - Ping Stats
Connectivity Stats - Ping Stats
Caution: Connectivity Stats - Ping Stats is an Early Field Trial (EFT) feature. EFTs are intended for test environments and are not supported for use in production networks. You should consult your local partner or Arista Networks account team before using any EFT feature or to provide feedback.
There are features and functions used in Arista NetVisor UNUM and Insight Analytics that are common throughout the user interface (UI). Please refer to the Common Functions section for more information on the use of these functions and features.
Selecting Analytics → Switch Analytics → Connectivity → Ping Stats displays the Ping Stats dashboard. The Ping Stats tab highlights.
The data contained in the Ping Stats dashboard is populated from the Mesh Ping connectivity function.
Select the applicable Fabric from the left-hand navigation bar and the dashboard updates showing all Ping Stats entries from all switches within the Fabric.
Ping Stats upper dashboard widgets include:
•Ping – Mgmt Int by Max Time (ms) – management interface by max time (ms).
•Ping – vRouters by Max Time (ms) – vRouters by max time (ms).
•Ping – vRouter Int by Max Time (ms) – vRouter interface by max time (ms).
•Ping – Mgmt Int by Max Packet Loss (percentage) – management interface by max packet loss (percentage).
•Ping – vRouters by Max Packet Loss (percentage) – vRouters by max packet loss (percentage).
•Ping – vRouter Int by Max Packet Loss (percentage) – vRouter interface by max packet loss (percentage).
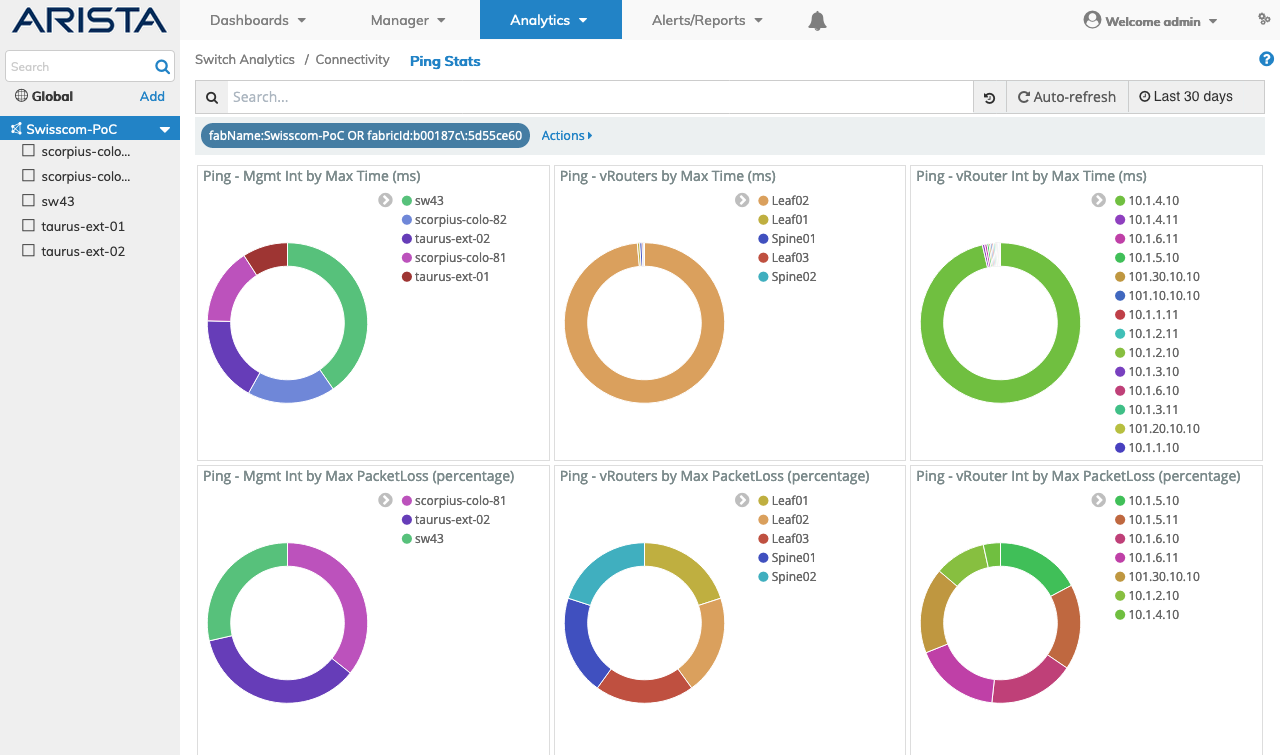
Switch Analytics Ping Stats Upper Dashboard
Ping Stats lower dashboard includes:
•Mesh Ping Stats – Details
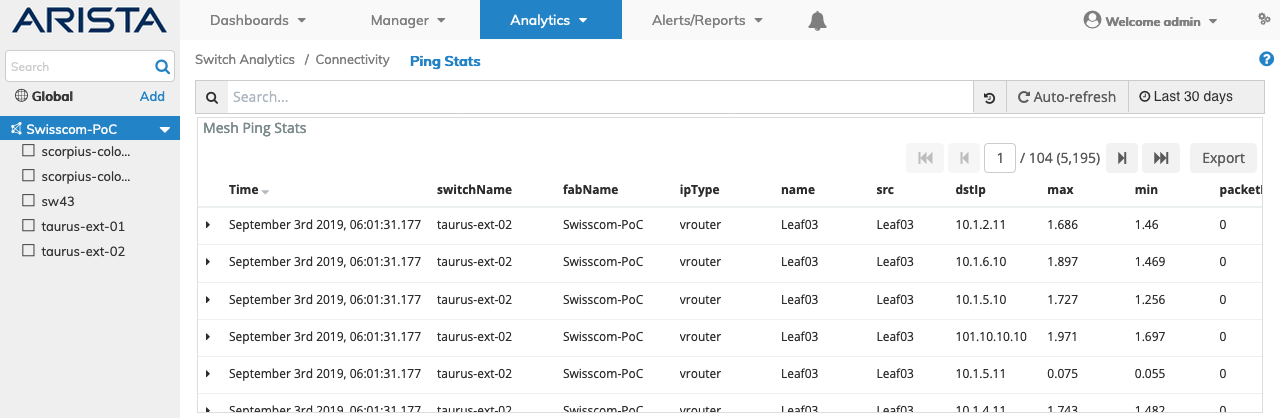
Switch Analytics Ping Stats Lower Dashboard
Selecting the applicable switch automatically updates the Ping Stats dashboard with information from the selected switch.
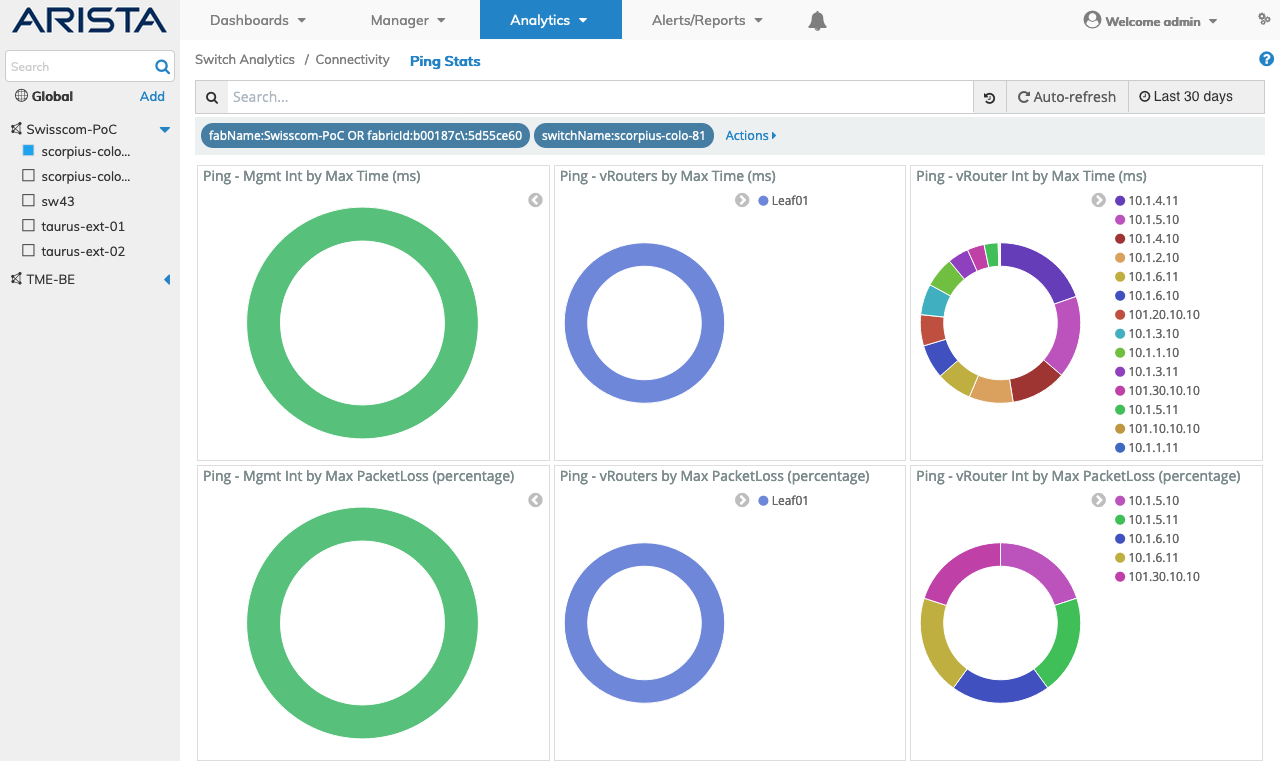
Switch Analytics Ping Stats Switch Dashboard
Widget Expand Feature
You expand and contract widgets by clicking on the ![]() icon.
icon.
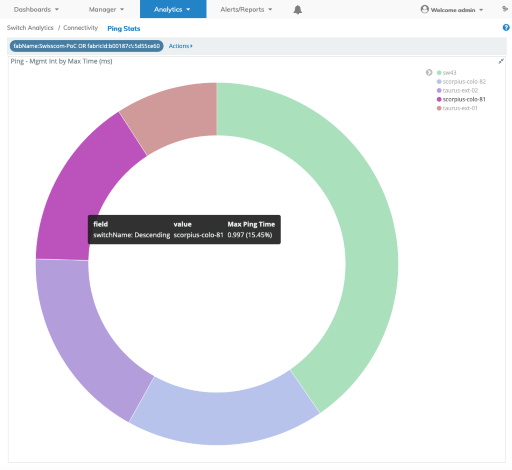
Switch Analytics Ping Stats Widget Expand & Rollover
Ping Stats Search
A Ping Stats Search function provides a useful method of searching for ping stats related information using an auto-populate feature based on previous searches.
You begin by entering a switch or vRouter name, or by clicking on an area of a pie chart or histogram.
The Ping Stats related information displayed in the graphical interface is updated with data from the search criteria and the filter information highlights in the filter bar.
Multiple searches populate the filter bar.
Ping Stats Filtering
Rolling over a column in the Mesh Ping - Details section reveals a ![]() icon used to Add or Remove filters from the search criteria.
icon used to Add or Remove filters from the search criteria.
Clicking on the ![]() icon in the Mesh Ping - Details section reveals Tabular and JSON data.
icon in the Mesh Ping - Details section reveals Tabular and JSON data.