
Notifications - Syslog
Notifications - Syslog
There are features and functions used in Arista NetVisor UNUM and Insight Analytics that are common throughout the user interface (UI). Please refer to the Common Functions section for more information on the use of these functions and features.
Selecting Analytics → Switch Analytics → Syslog displays the Syslog dashboard. The Syslog tab highlights.
The Syslog dashboard displays syslog data by host on the selected switch where Syslog logging is enabled.
Select the applicable Fabric from the left-hand navigation bar and the dashboard updates showing all Syslog entries from all switches within the Fabric.
Usage Note: Syslog information displayed is based on syslog settings under Manager → Security/Monitoring → Manage Syslog described here in this document.
Syslog upper dashboard widgets include:
•Syslog – Severity by Switch – pie chart of switch name and severity count.
•Syslog – Severity Timeline – bar chart of warning type over time.
•Syslog – Total Count – total count of number syslog events.
•Syslog – Category by Host – pie chart of switch name and category count.
•Syslog – Category Timeline – bar chart of category type over time.
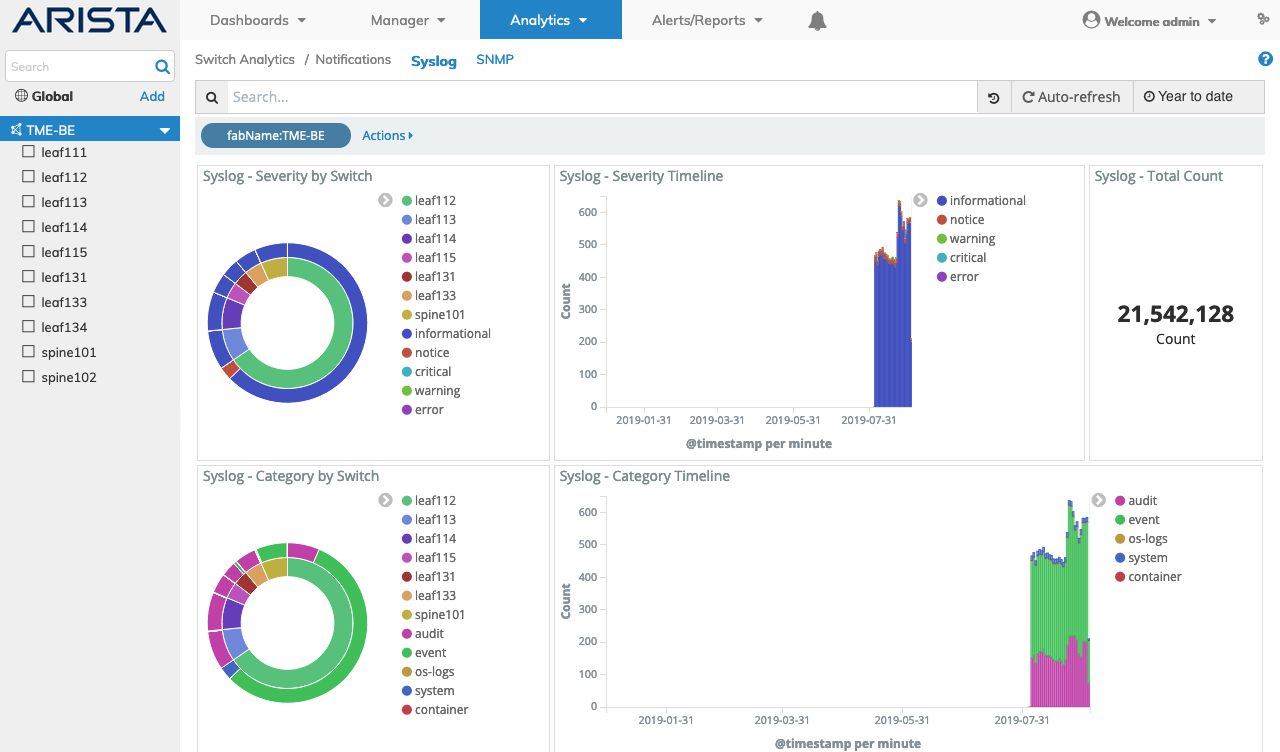
Switch Analytics Notifications Syslog Dashboard
Syslog lower dashboard include:
•Syslog Details – Details
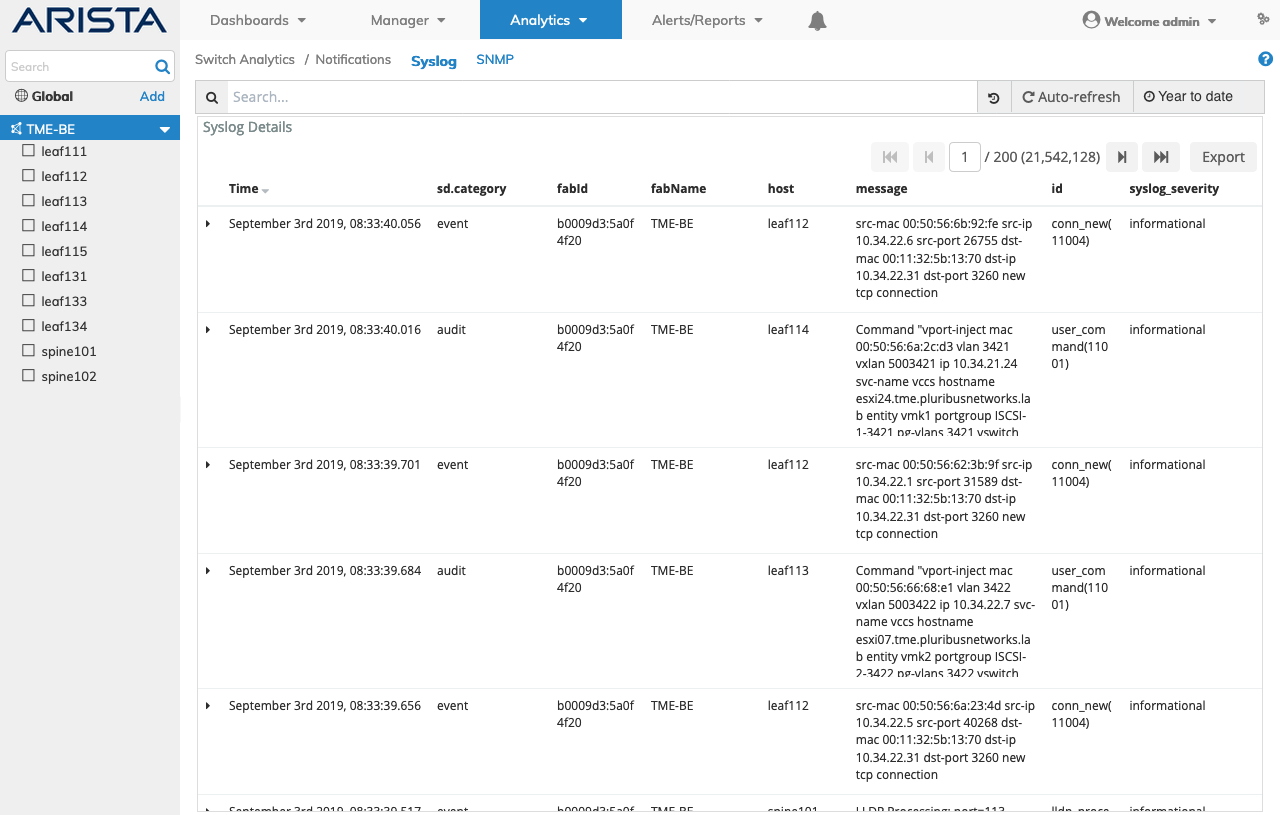
Switch Analytics Notifications Syslog Lower Dashboard
Selecting the applicable switch automatically updates the Syslog dashboard with information from the selected switch.
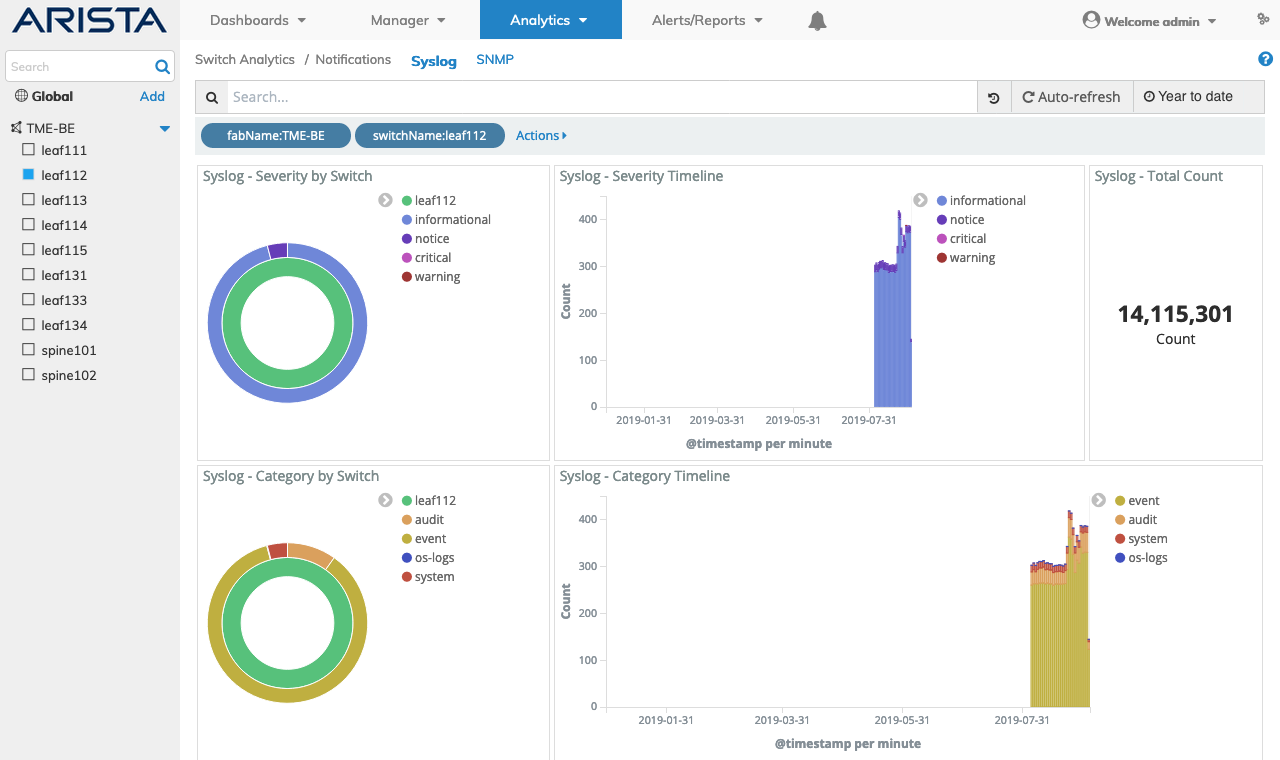
Switch Analytics Notifications Syslog Switch Upper Dashboard
Widget Expand Feature
You expand and contract widgets by clicking on the ![]() icon.
icon.
Switch Analytics Notifications Syslog Widget Expand & Rollover
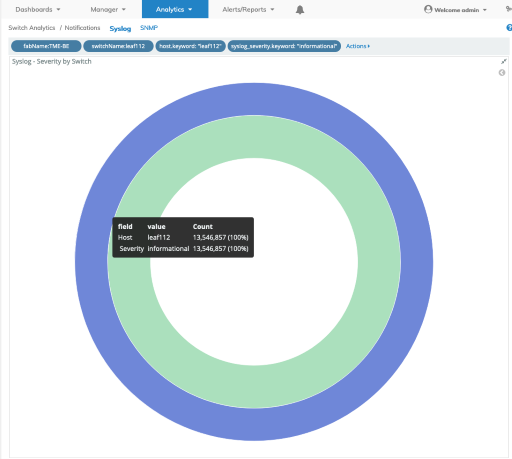
Data Rollover
Rolling over data areas of pie charts and/or bar charts reveals more granular information.
Syslog Search
A Syslog Search function provides a useful method of searching for syslog related information using an auto-populate feature.
You begin by entering relevant search criteria.
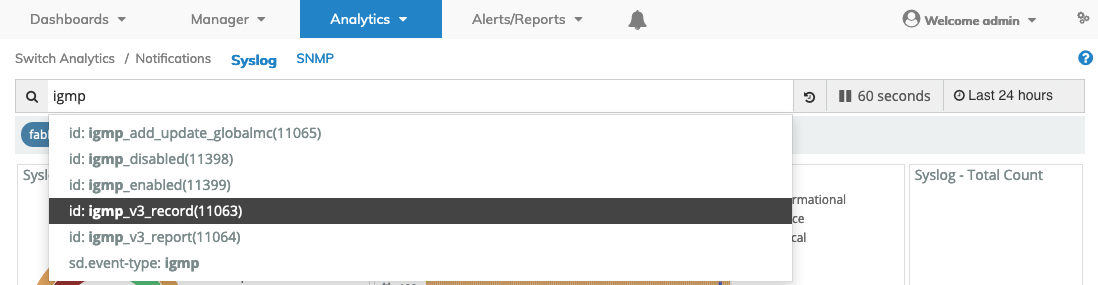
Switch Analytics Notifications Syslog Search
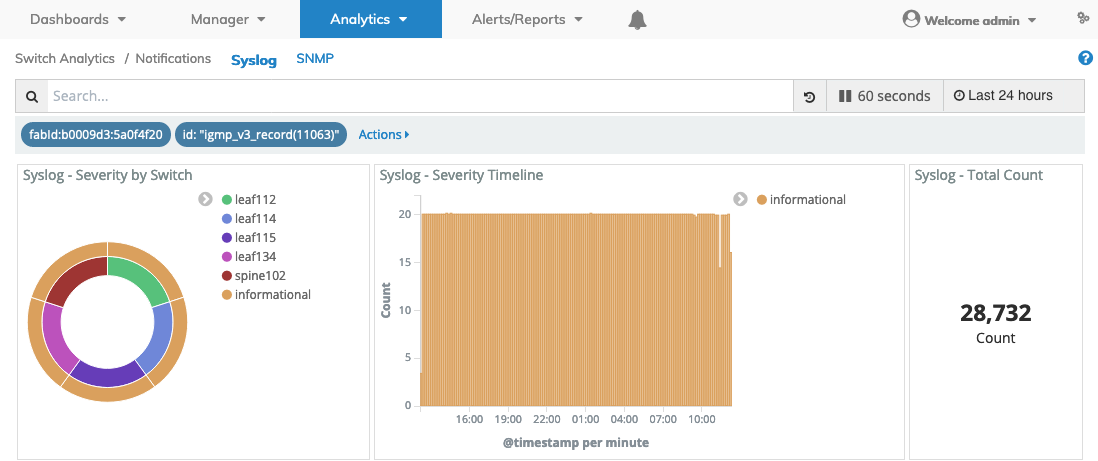
Switch Analytics Notifications Syslog Search Results
Clicking on an area of a pie chart or histogram builds additional filter criteria.
Multiple searches populate the filter bar. You must Apply the filter or Cancel to return to the previous settings.
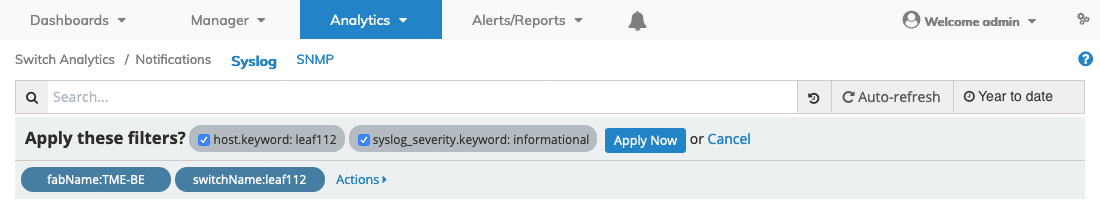
Switch Analytics Notifications Syslog Filters
The syslog related information displayed in the graphical interface is updated with data from the search criteria and the filter information highlights in the filter bar.
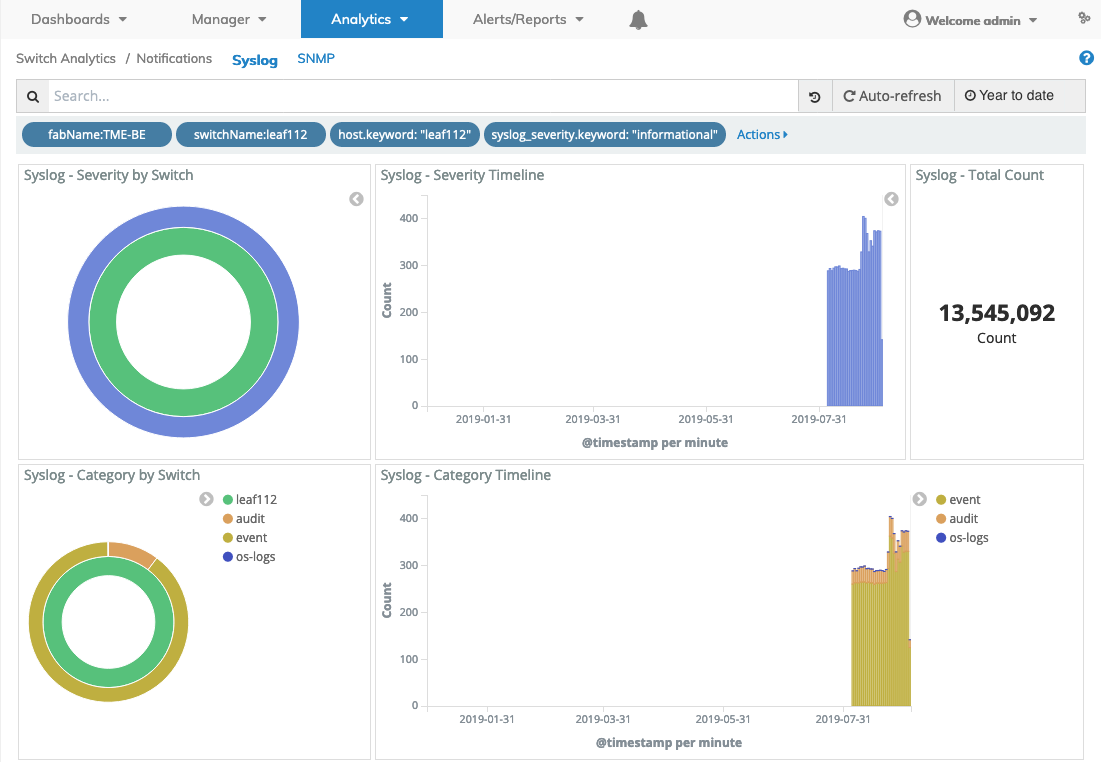
Switch Analytics Notifications Syslog Filters Applied
Syslog Filtering
Rolling over a column in the Syslog - Details section reveals a ![]() icon used to Add or Remove filters from the search criteria.
icon used to Add or Remove filters from the search criteria.
Clicking on the ![]() icon in the Syslog - Details section reveals Tabular and JSON data.
icon in the Syslog - Details section reveals Tabular and JSON data.