
System Stats - CPU / Memory
System Stats - CPU / Memory
There are features and functions used in Arista NetVisor UNUM and Insight Analytics that are common throughout the user interface (UI). Please refer to the Common Functions section for more information on the use of these functions and features.
Selecting Analytics → Switch Analytics → System Stats → CPU / Memory displays the CPU / Memory dashboard. The CPU / Memory tab highlights.
Select the applicable Fabric from the left-hand navigation bar and the dashboard updates showing all SysStats entries from all switches within the Fabric.
CPU / Memory upper dashboard widgets include:
•SysStats – Uptime by device
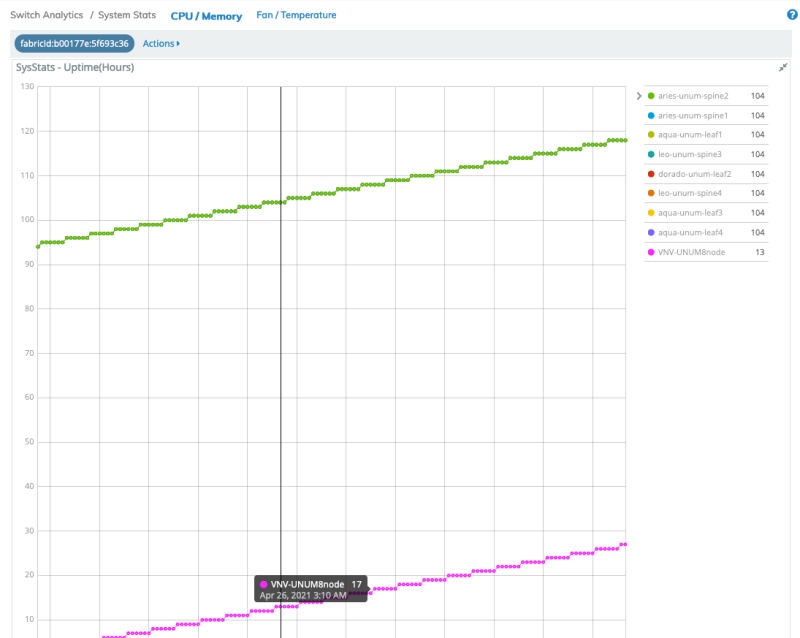
•SysStats – Uptime (Hours)
•SysStats – CPU AVG
•SysStats – Memory
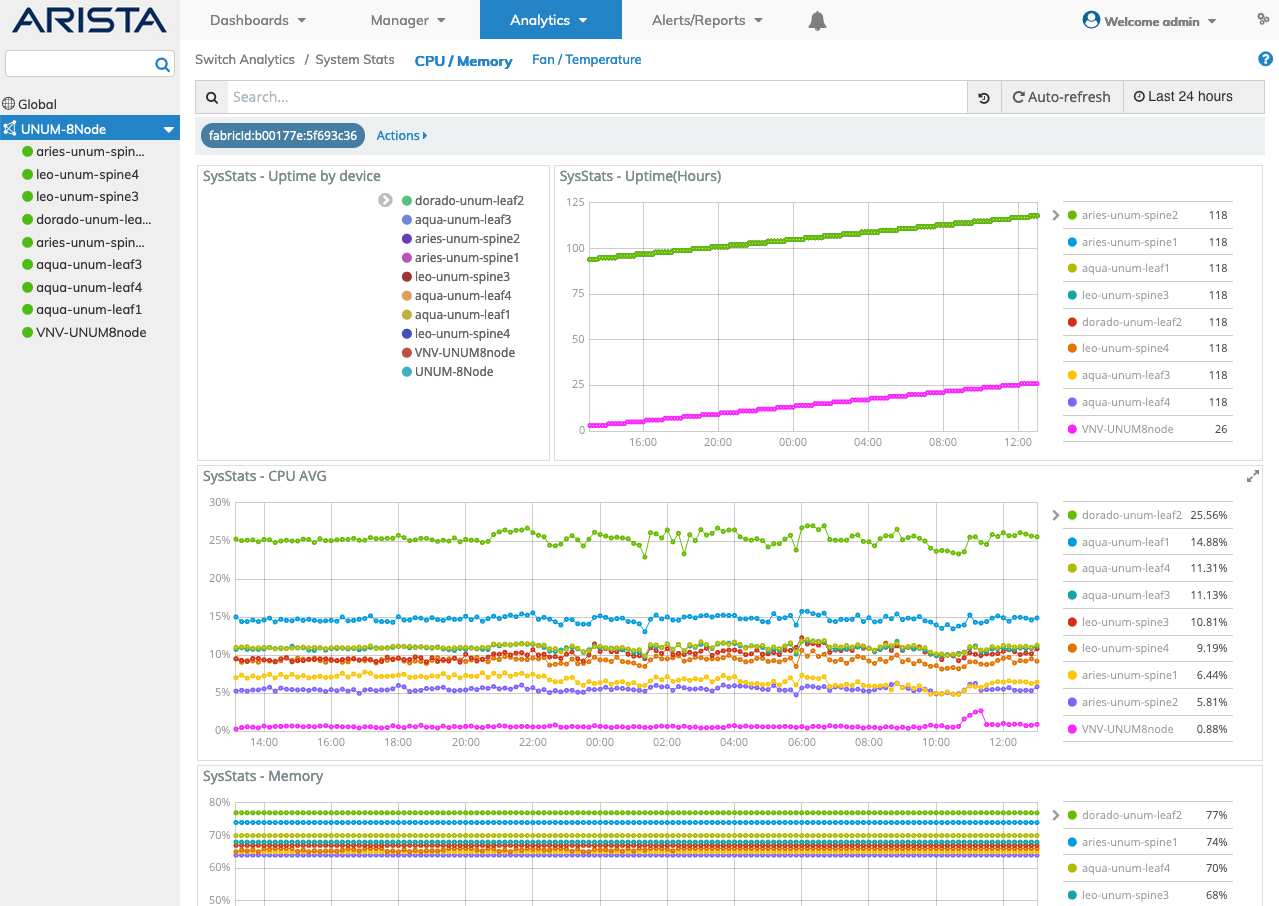
Switch Analytics CPU / Memory Upper Dashboard
CPU / Memory lower dashboard includes:
•SysStats – Details

Switch Analytics CPU / Memory Lower Dashboard
Selecting the applicable switch automatically updates the CPU / Memory dashboard with information from the selected switch.
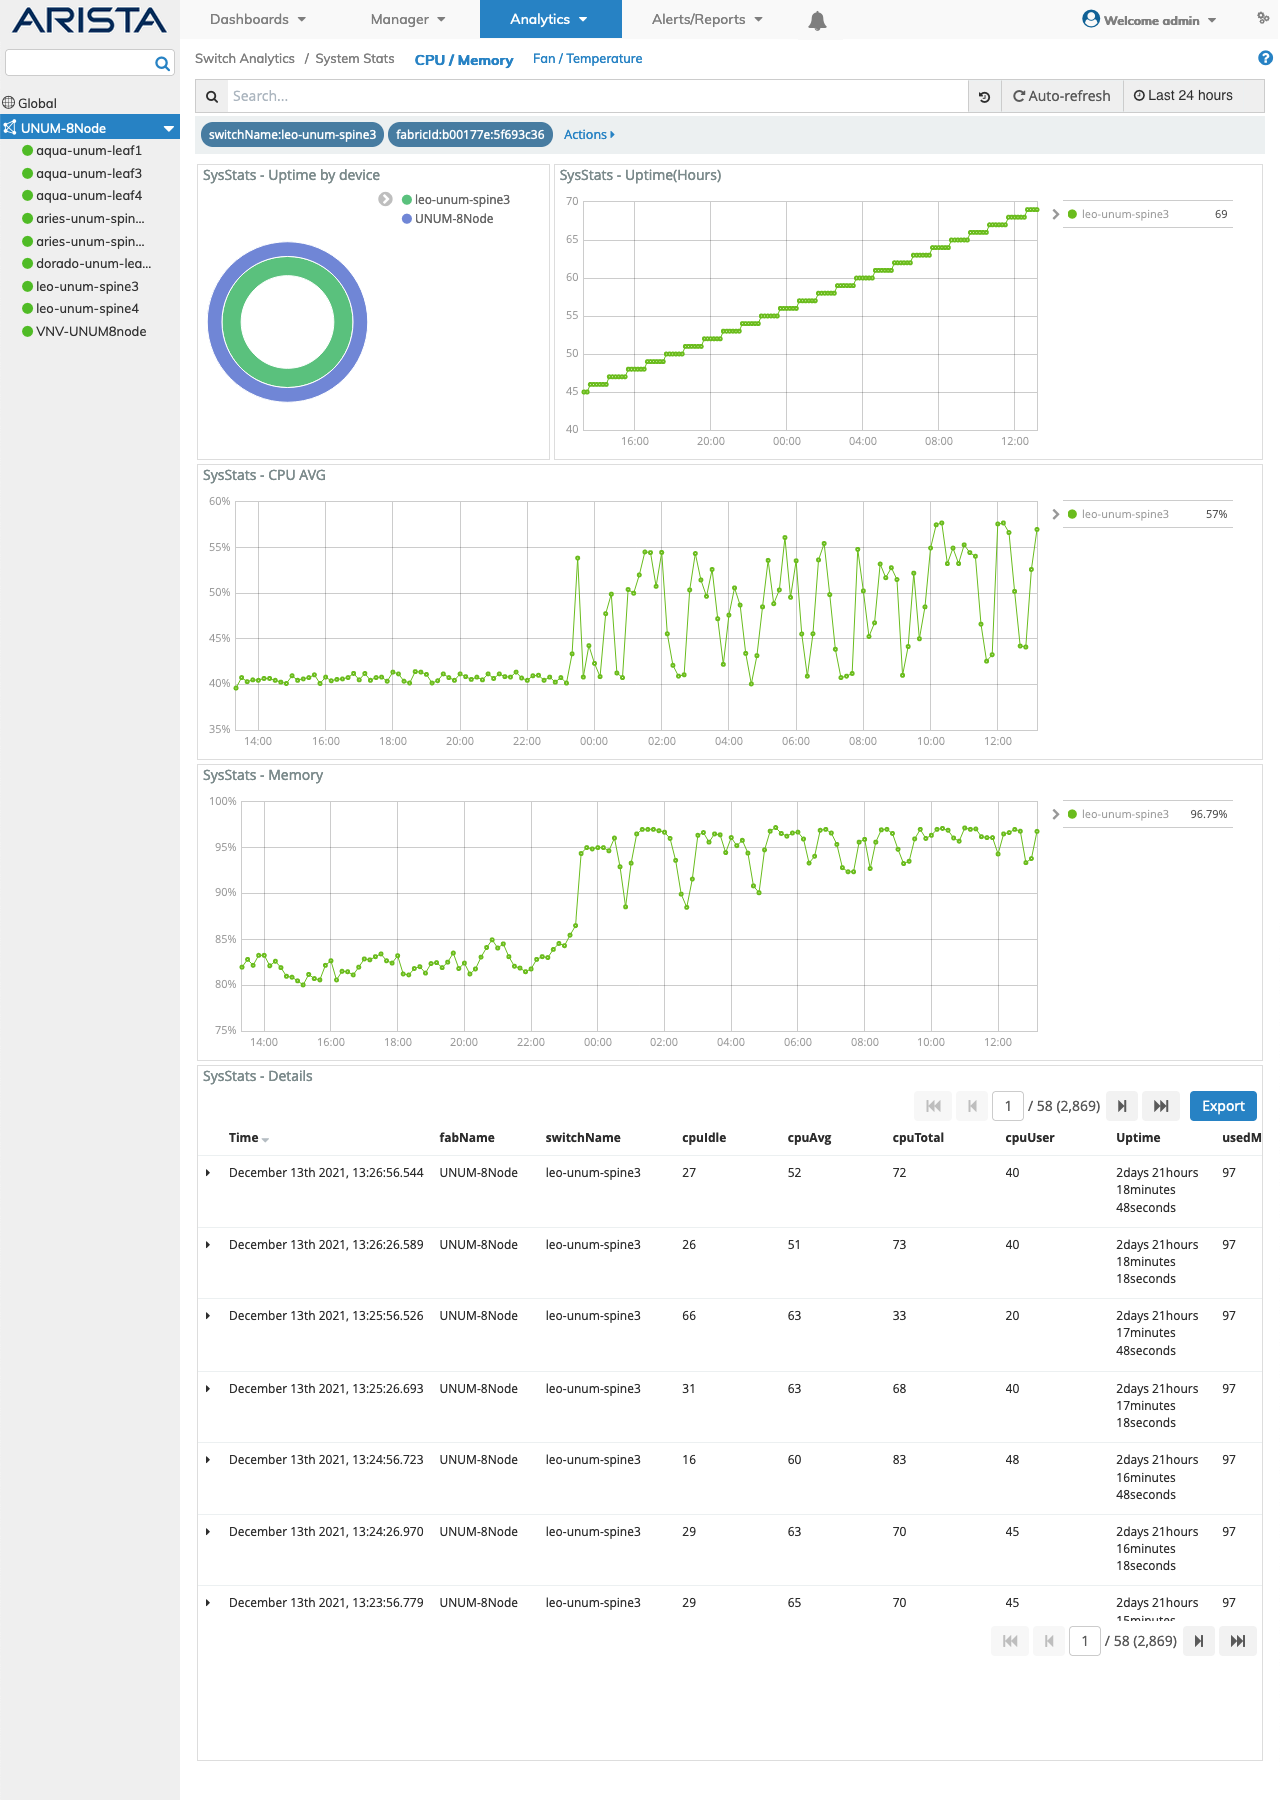
Switch Analytics CPU / Memory Switch Dashboard
Dashboard Rollover
Rolling over data areas of widgets and/or bar charts reveals more granular information and statistics.
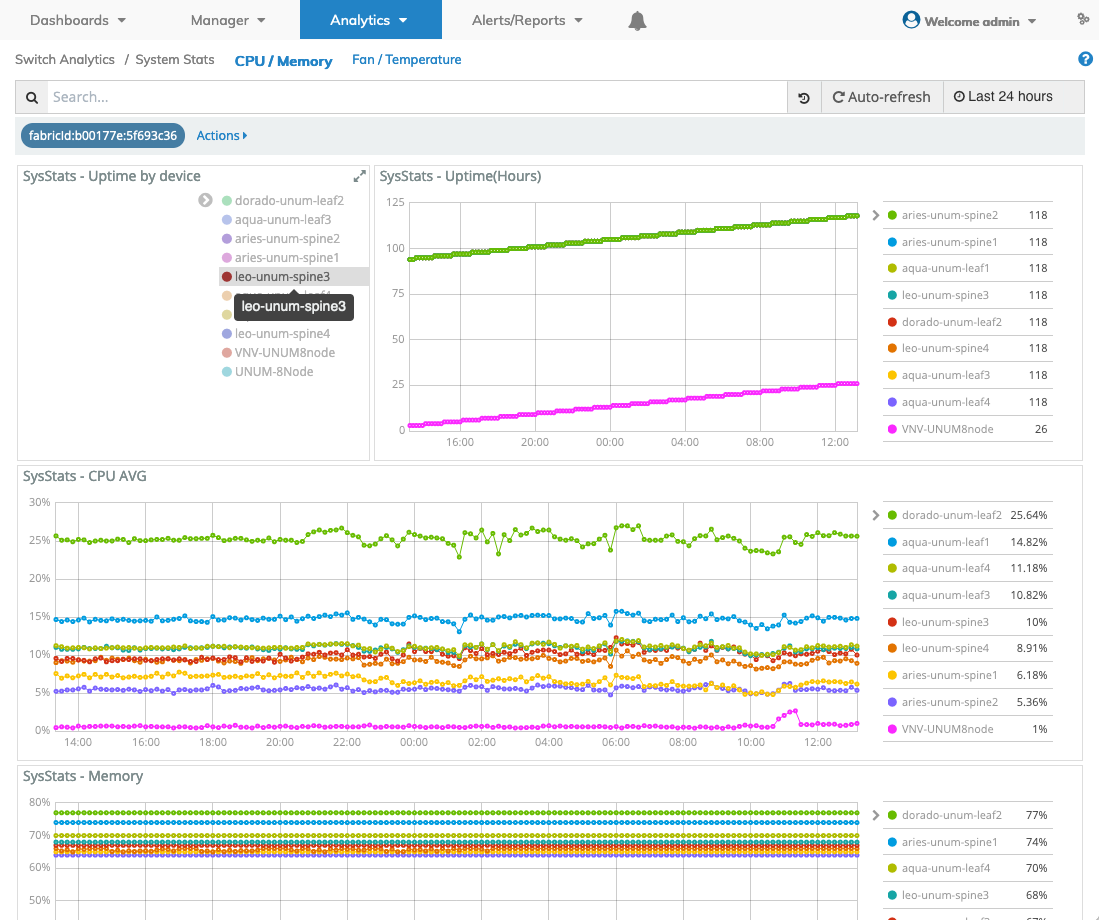
Switch Analytics CPU / Memory Dashboard Rollover
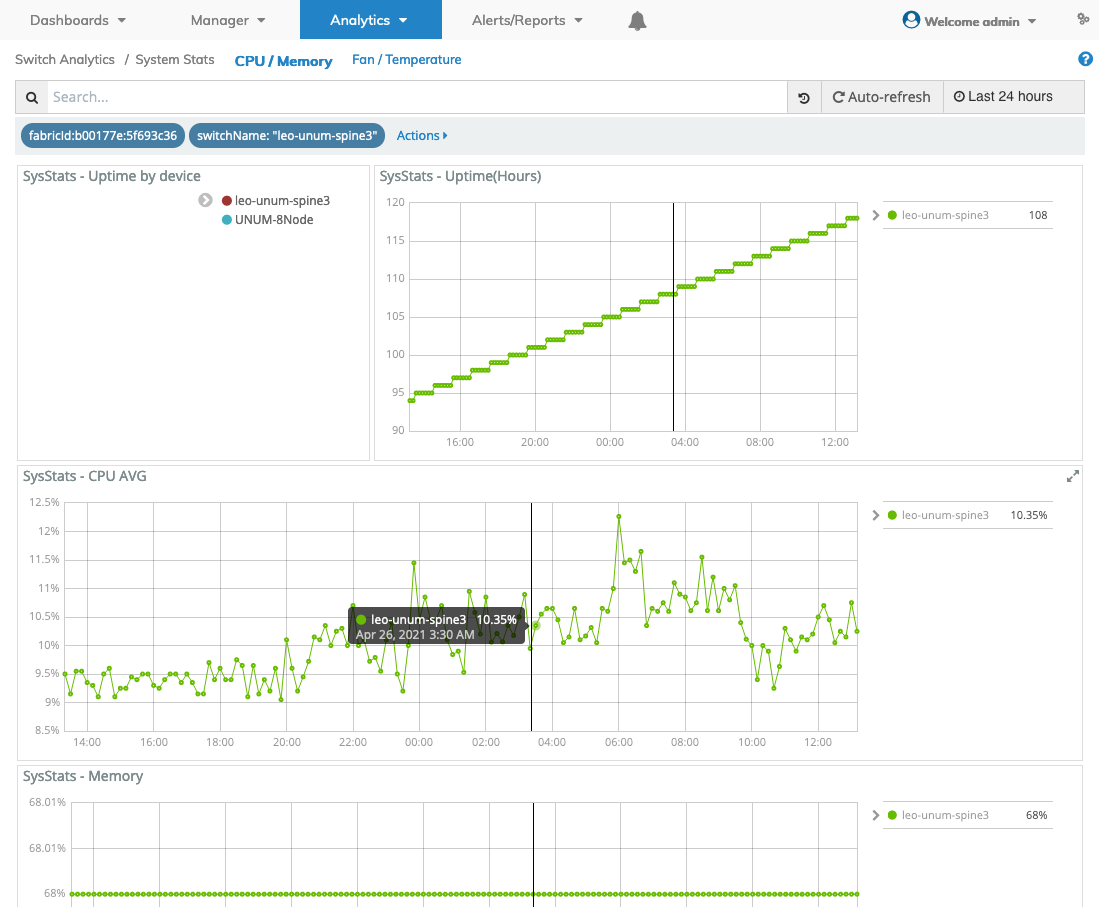
Switch Analytics CPU / Memory Dashboard Drill Down & Rollover
Widget Expand Feature
You expand and contract widgets by clicking on the ![]() icon.
icon.
Switch Analytics CPU / Memory Widget Expand
CPU / Memory Search
A CPU / Memory Search function provides a useful method of searching for system stats related information using an auto-populate feature based on previous searches.
You begin by entering a switch name, or by clicking on an area of a pie chart or histogram.
The CPU / Memory related information displayed in the graphical interface is updated with data from the search criteria and the filter information highlights in the filter bar.
Multiple searches populate the filter bar.
CPU / Memory Filtering
Rolling over a column in the SysStats - Details section reveals a ![]() icon used to Add or Remove filters from the search criteria.
icon used to Add or Remove filters from the search criteria.
Clicking on the ![]() icon in the SysStats - Details section reveals Tabular and JSON data.
icon in the SysStats - Details section reveals Tabular and JSON data.