
Traffic - Tunnel Stats
Traffic - Tunnel Stats
There are features and functions used in Arista NetVisor UNUM and Insight Analytics that are common throughout the user interface (UI). Please refer to the Common Functions section for more information on the use of these functions and features.
Selecting Analytics → Switch Analytics → Traffic → Tunnel Stats displays the Tunnel Stats dashboard. The Tunnel Stats tab highlights.
A Tunnel is a virtual connection between two fabric end points. The Tunnel Stats dashboard displays both virtual link extension (vLE) and VXLAN tunnels.
The Tunnel Stats dashboard displays fabric-wide tunnel information in a consolidated view listing statistical information by switch in the fabric.
The Tunnel Stats dashboard widgets include:
•TunnelStats - Summary – tunnel details and statistical summary based on time selection (eg. Last 15 minutes).
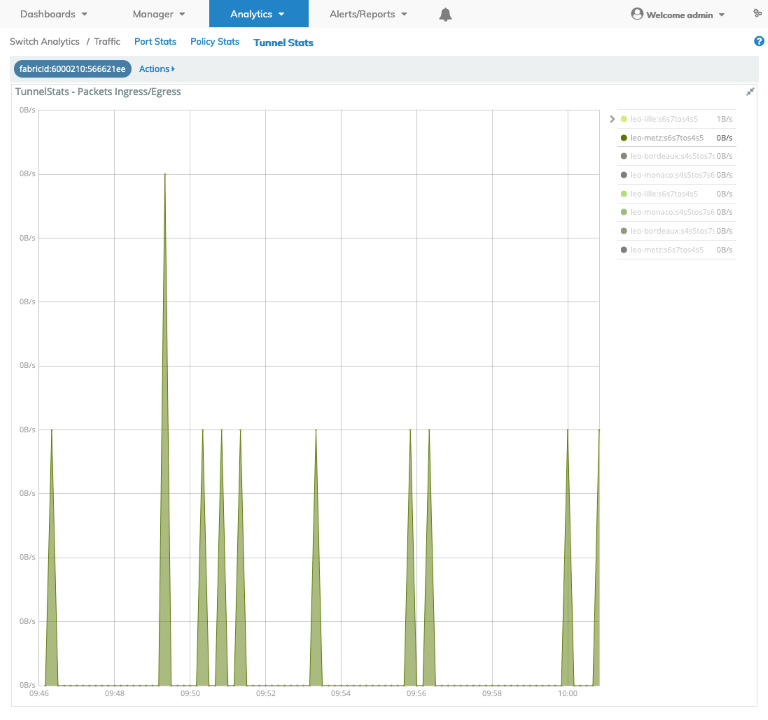
•TunnelStats - Packet Ingress/Egress – time series graph of ingress and egress packets in the fabric by tunnelname (switch / tunnel combination).
•TunnelStats - Bits Ingress/Egress – time series graph of ingress and egress bits in the fabric by tunnelname.
•TunnelStats - Errors Ingress/Egress – time series graph of ingress and egress errors in the fabric by tunnelname.
•TunnelStats - CongestionDropPkts Ingress/Egress – time series graph of ingress and egress congestion and dropped packets in the fabric by tunnelname.
•TunnelStats - MtuErrors Ingress/Egress – time series graph of ingress and egress MTU errors in the fabric by tunnelname.
•TunnelStats - Details – detailed information of tunnel statistics.
Visual Color Indicators
Widgets displayed throughout the Tunnel Stats dashboard use the following color visual indicators:
•Packets - Green
•Bits/Bytes - Blue
•Congestion drop packets - Yellow
•Error - Orange
•MtuErrors - Red
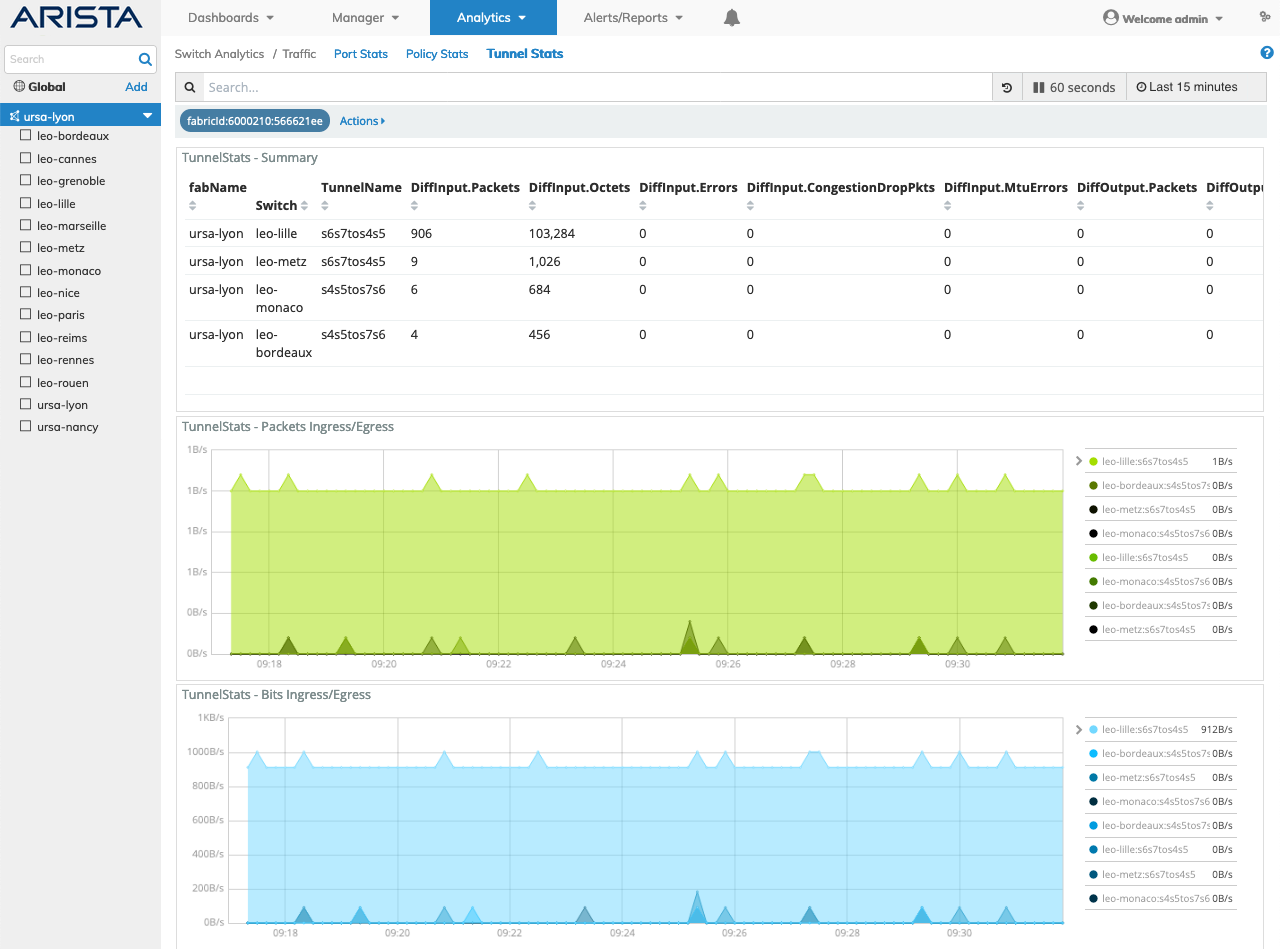
Switch Analytics Tunnel Stats Consolidated Display
Rolling over certain columns in the PortStats - Summary section reveals a ![]() icon used to Add or Remove filters from the search criteria.
icon used to Add or Remove filters from the search criteria.
Tunnel Stats Search
A Tunnel Stats Search function provides a useful method of searching for Tunnel related information using an auto-populate feature based on previous searches.
You begin by entering relevant search criteria.
The Tunnel related information displayed in the graphical interface is updated with data from the search criteria and the filter information highlights in the filter bar.
Multiple searches populate the filter bar.
For example, a search for s4 reveals:
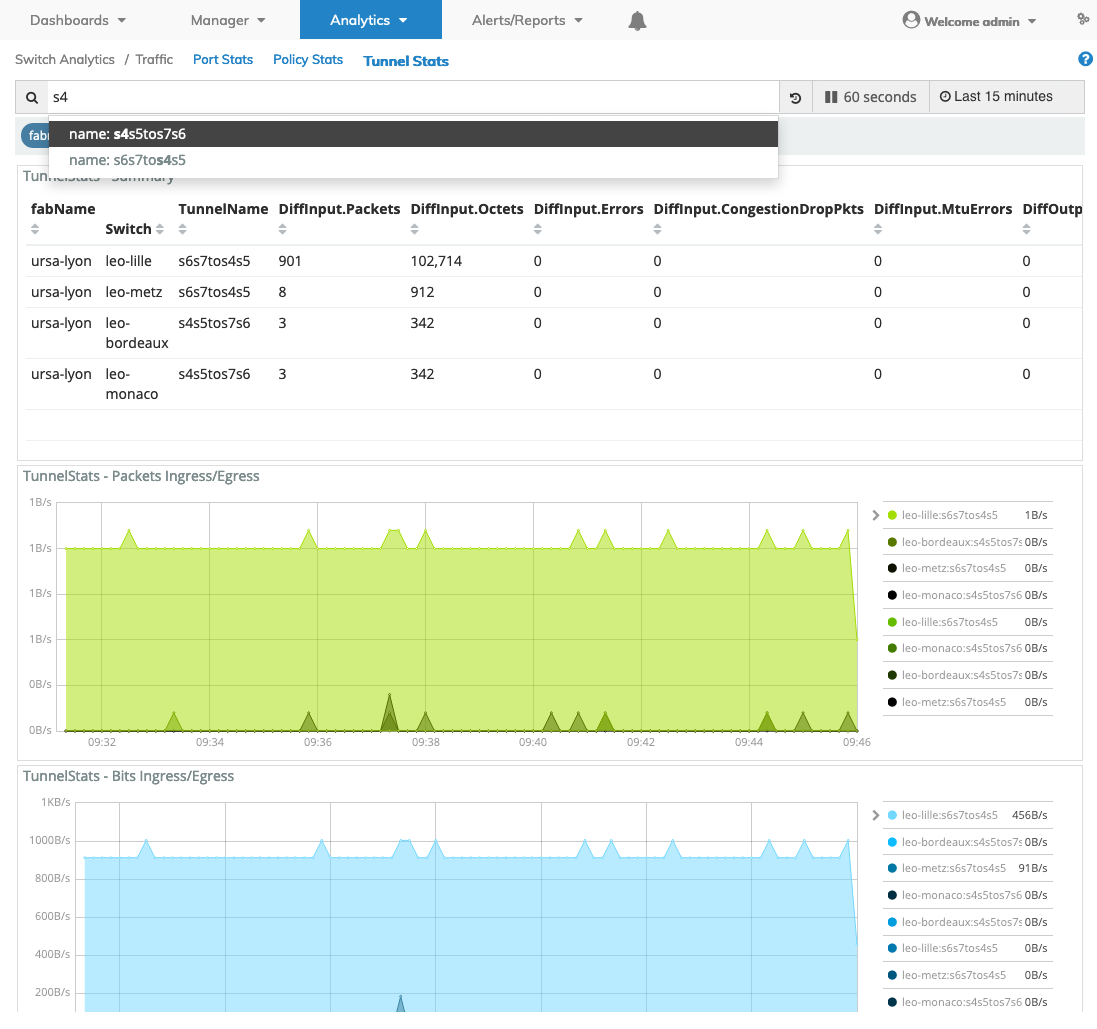
Switch Analytics Tunnel Stats Quick Search Port Number
Widget Expand Feature
You expand and contract widgets by clicking on the ![]() icon.
icon.
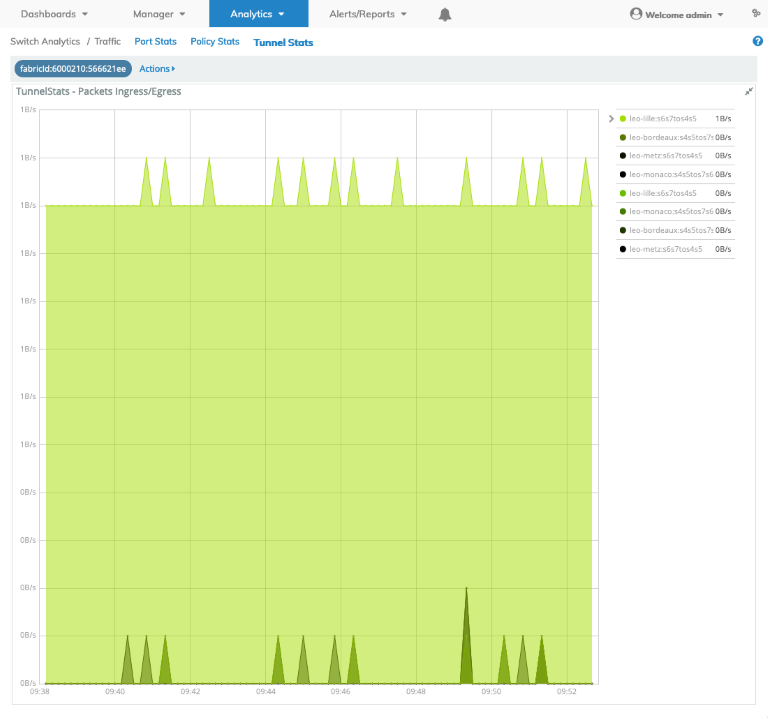
Switch Analytics Tunnel Stats Widget Expand / Contract
Data Rollover
Rolling over data areas of widget pie charts, bar charts and graphs reveal more granular information.
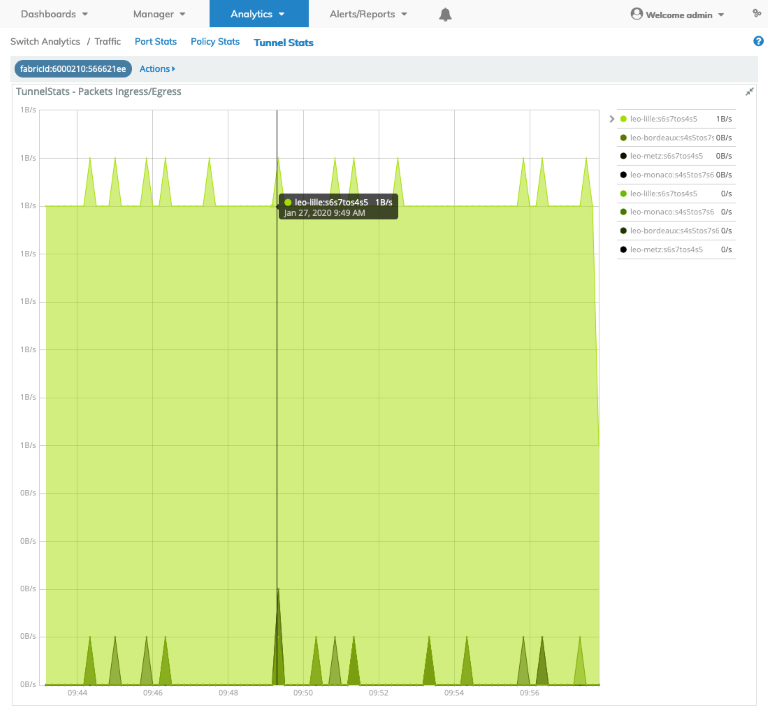
Switch Analytics Tunnel Stats Widget Rollover
Clicking on a switch name listed in the legend further refines the widget dashboard providing detailed and specific ingress or egress information.
Switch Analytics Tunnel Stats Widget Rollover by Switch
Tunnel Stats by Switch
Select a switch and the Tunnel Stats dashboard displays switch tunnel information in a consolidated view listing statistical information.
The switch dashboards operate similarly to the fabric-wide dashboards described above.