
System Stats - Fan / Temperature
System Stats - Fan / Temperature
There are features and functions used in Arista NetVisor UNUM and Insight Analytics that are common throughout the user interface (UI). Please refer to the Common Functions section for more information on the use of these functions and features.
Selecting Analytics → Switch Analytics → System Stats → Fan / Temperature displays the Fan / Temperature dashboard.
Select the applicable Fabric from the left-hand navigation bar and the dashboard updates showing all Switch Status entries from all switches within the Fabric.
The Filter Bar displays the Fabric ID.
Fan / Temperature upper dashboard widgets include:
•Switch Status – Temp Status
•Switch Status – Fan Status
•Switch Status - Details
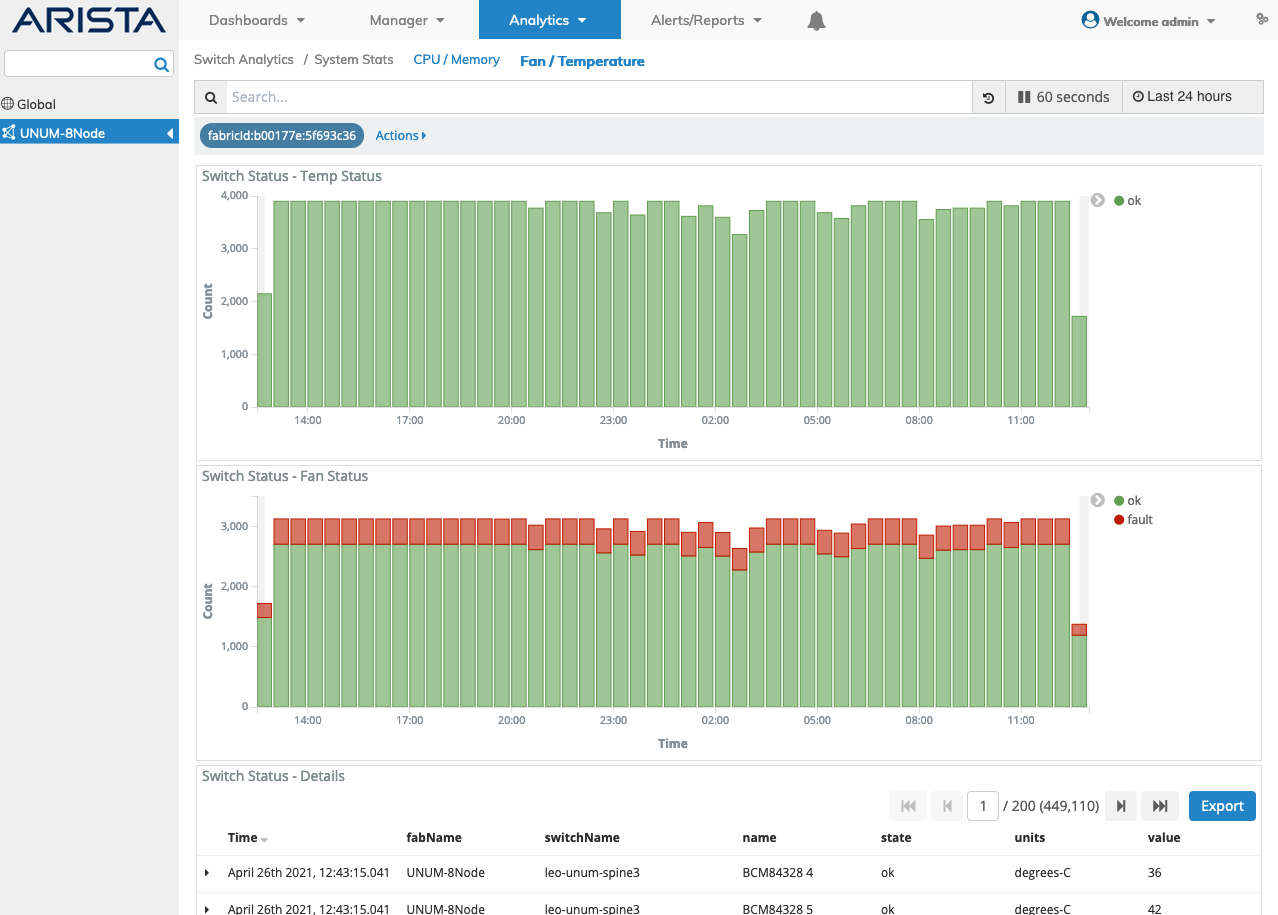
Switch Analytics - Fan / Temperature Fabric Dashboard
Rollover a section of the histogram to obtain granular information from a time slice.
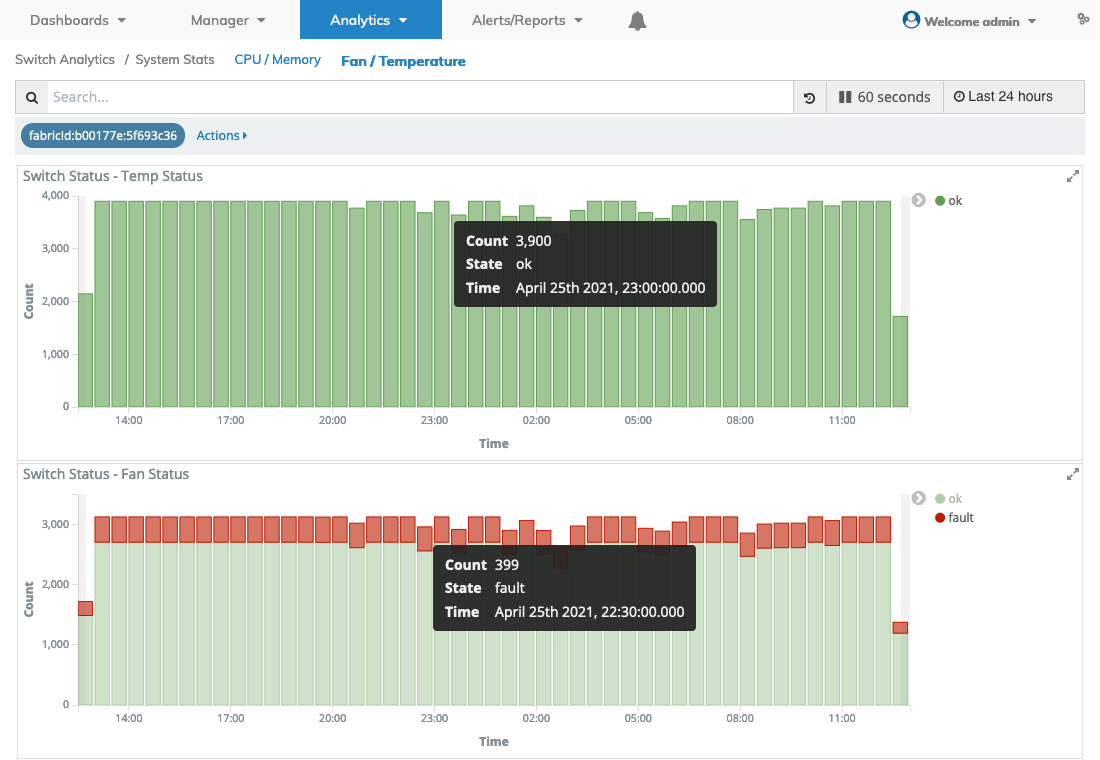
Switch Analytics - Fan / Temperature Rollover
Select the applicable Switch from the left-hand navigation bar and the dashboard updates showing the Fan / Temperature data from the chosen switch.
The Filter Bar updates with the selected switch name.
Fan / Temperature upper dashboard widgets include:
•Switch Status – Temp Status
•Switch Status – Fan Status
•Switch Status - Details
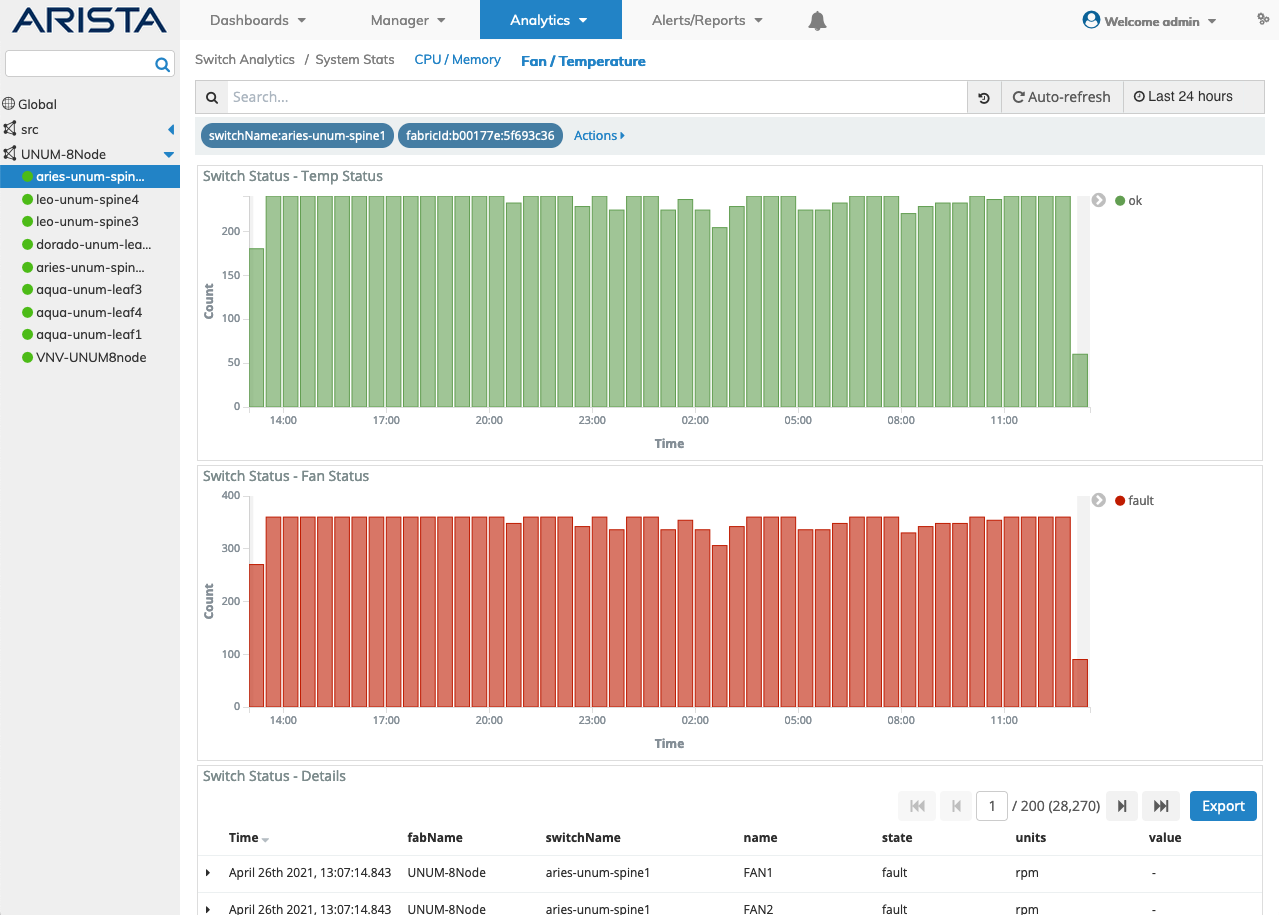
Switch Analytics - Fan / Temperature of Individual Switch
Rollovers work as described above.