
Analytics
Analytics
There are features and functions used in Arista NetVisor UNUM and Insight Analytics that are common throughout the user interface (UI). Please refer to the Common Functions section for more information on the use of these functions and features.
Insight Analytics tracks network and endpoint service state and performance across the Fabric to understand how the users and services are consuming the infrastructure and how it supports the users and services.
The intelligence enables operators to analyze and compare actual versus applicable performance, and implement corrective actions such as policy changes, rerouting traffic to implement on-demand modifications to the infrastructure.
NetVisor UNUM Analytics provides a suite of analysis tools designed to analyze data with search capabilities on data collected from NetVisor UNUM collectors, packet capture analytics and monitoring capabilities.
There are two main categories of analytics provided by NetVisor UNUM:
•Insight Analytics – This is an add-on license for NetVisor UNUM that enables users to view traffic flow patterns at a high level, then drill down via a series of dashboards and widgets to isolate fabric events. A NetVisor OS switch directly collects flow metadata at wire speed through the NetVisor OS Flow (nvFlow) protocol and stores this data in an Elastic database for rapid access.
•Switch Analytics – A suite of tools that enable administrators to monitor system, traffic and connectivity statistics, manage Syslog notifications, and display active endpoints or vPorts statistics. The base NetVisor UNUM license includes Switch Analytics.
For more details please refer to the NetVisor OS and NetVisor OS Configuration Guides at www.pluribusnetworks.com/support/technical-documentation.
Left-Hand Navigation (LHN) Pane
In general, the Left-Hand Navigation (LHN) pane displays the following characteristics for the following dashboards:
•When selecting a Super-Fabric on the LHN, it will display all the switches under the selected Super-Fabric.
•When selecting a Fabric under the Super-Fabric on the LHN, it will show only those switches under the selected Fabric, irrespective of the Fabric belonging to the Super-Fabric.
•When selecting a switch on the LHN, it will display the information for only the designated switch.
NetVisor UNUM Insight Analytics
NetVisor UNUM Switch Analytics Application Menu
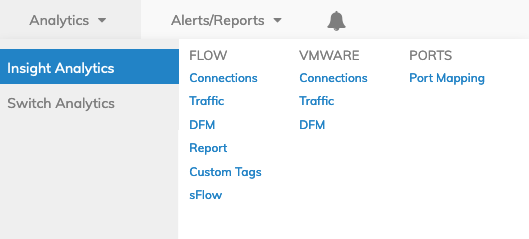
Selecting Analytics → Insight Analytics displays all Insight Analytics functions within NetVisor UNUM. These include:
•Flow – Traffic Flow
Note: As of July 2021, sFlow is no longer supported.
•VMware – VMware Traffic
▪DFM - VMware Dynamic Flow Mapping
•Ports – Ports
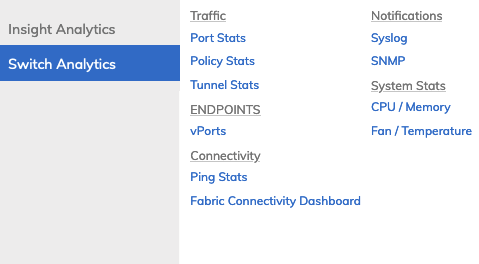
Selecting Analytics → Switch Analytics displays all Switch Analytics functions within NetVisor UNUM. These include:
Traffic – Port and Tunnel Stats
Endpoints – vPorts
System Stats – CPU / Memory
Connectivity – Ping Stats, Fabric Connectivity Dashboard
Note:
The Insight Analytics database stores Flow Connections related data for 30 days.
The Switch Analytics database stores vPort, SNMP, Syslog, and Port Stats for 30 days and Tunnel Stats, SNMP, Syslog, CPU/Memory, and Ping Stats for 7 days.