
Traffic - Port Stats
Traffic - Port Stats
There are features and functions used in Arista NetVisor UNUM and Insight Analytics that are common throughout the user interface (UI). Please refer to the Common Functions section for more information on the use of these functions and features.
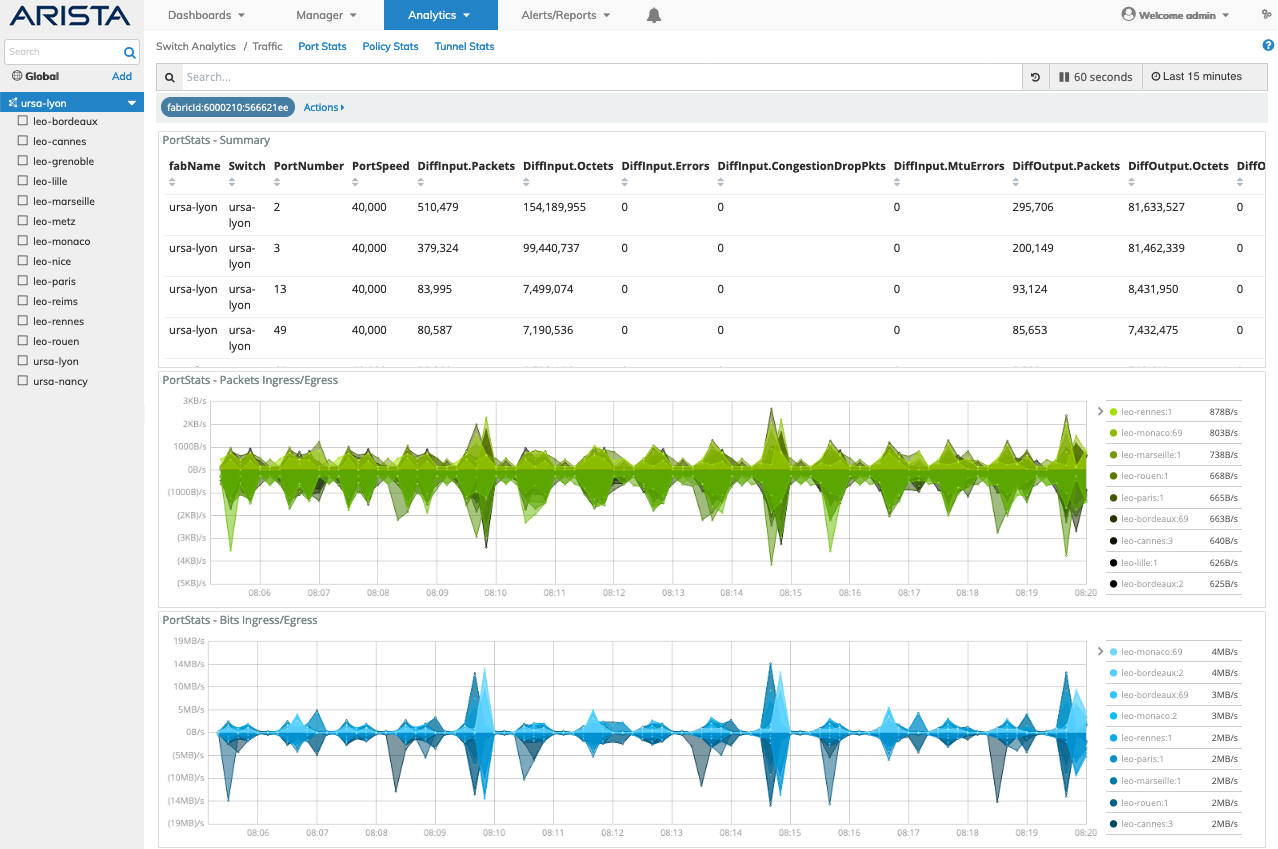
Selecting Analytics → Switch Analytics → Traffic → Port Stats displays the Port Stats dashboard. The Port Stats tab highlights.
The Port Stats dashboard displays fabric-wide port information in a consolidated view listing statistical information by switch in the fabric.
The Port Stats dashboard widgets include:
•PortStats - Summary – port details and statistical summary based on time selection (eg. Last 15 minutes).
•PortStats - Packet Ingress/Egress – time series graph of ingress and egress packets in the fabric by portlocator (switch / port combination).
•PortStats - Bits Ingress/Egress – time series graph of ingress and egress bits in the fabric by portlocator.
•Portstats - Errors Ingress/Egress – time series graph of ingress and egress errors in the fabric by portlocator.
•PortStats - CongestionDropPkts Ingress/Egress – time series graph of ingress and egress congestion and dropped packets in the fabric by portlocator.
•PortStats - MtuErrors Ingress/Egress – time series graph of ingress and egress MTU errors in the fabric by portlocator.
•Port-Stats - Details – detailed information of port statistics.
Visual Color Indicators
Widgets displayed throughout the Port Stats dashboard use the following color visual indicators:
•Packets - Green
•Bits/Bytes - Blue
•Congestion drop packets - Yellow
•Error - Orange
•MtuErrors - Red
Switch Analytics Port Stats Consolidated Display
Rolling over certain columns in the PortStats - Summary section reveals a ![]() icon used to Add or Remove filters from the search criteria.
icon used to Add or Remove filters from the search criteria.
Port Stats Search
A Port Stats Search function provides a useful method of searching for Port related information using an auto-populate feature based on previous searches.
You begin by entering relevant search criteria.
The Port related information displayed in the graphical interface is updated with data from the search criteria and the filter information highlights in the filter bar.
Multiple searches populate the filter bar.
For example, a search for port 73 reveals:
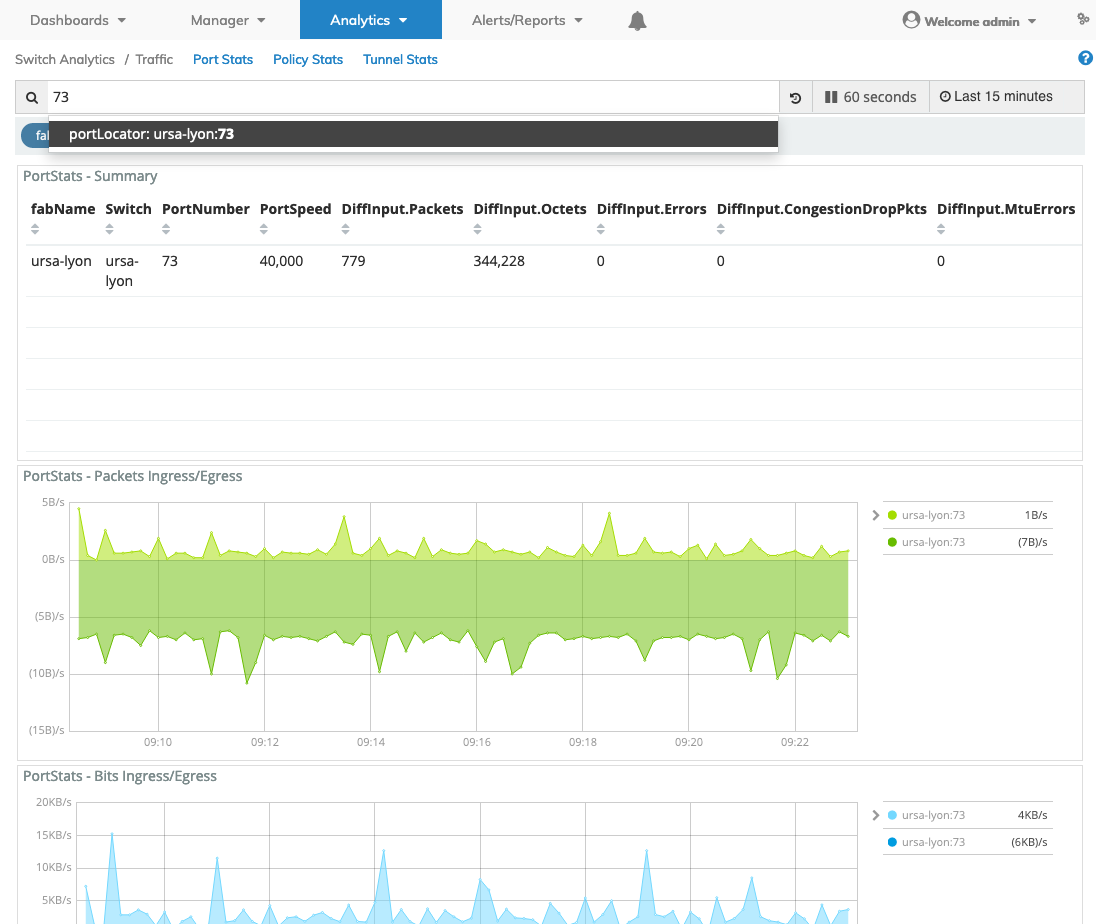
Switch Analytics Port Stats Quick Search Port Number
Port Stats Filtering
Rolling over a column in the Port - Stats - Details section reveals a ![]() icon used to Add or Remove filters from the search criteria.
icon used to Add or Remove filters from the search criteria.
Clicking on the ![]() icon in the Port - Stats - Details section reveals Tabular and JSON data.
icon in the Port - Stats - Details section reveals Tabular and JSON data.
Filtering functions work in a similar manner as described under the Common Features - Search & Filtering section.
Widget Expand Feature
You expand and contract widgets by clicking on the ![]() icon.
icon.
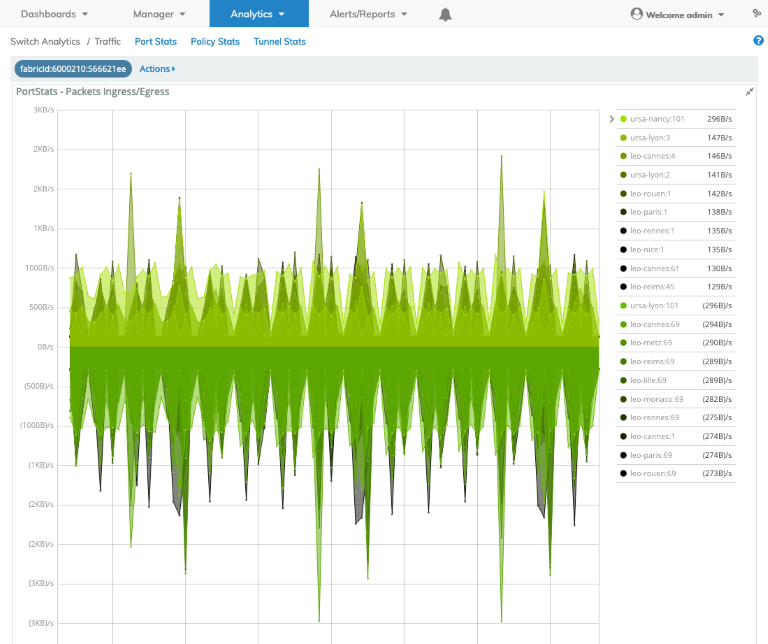
Switch Analytics Port Stats Widget Expand / Contract
Data Rollover
Rolling over data areas of widget pie charts, bar charts and graphs reveal more granular information.
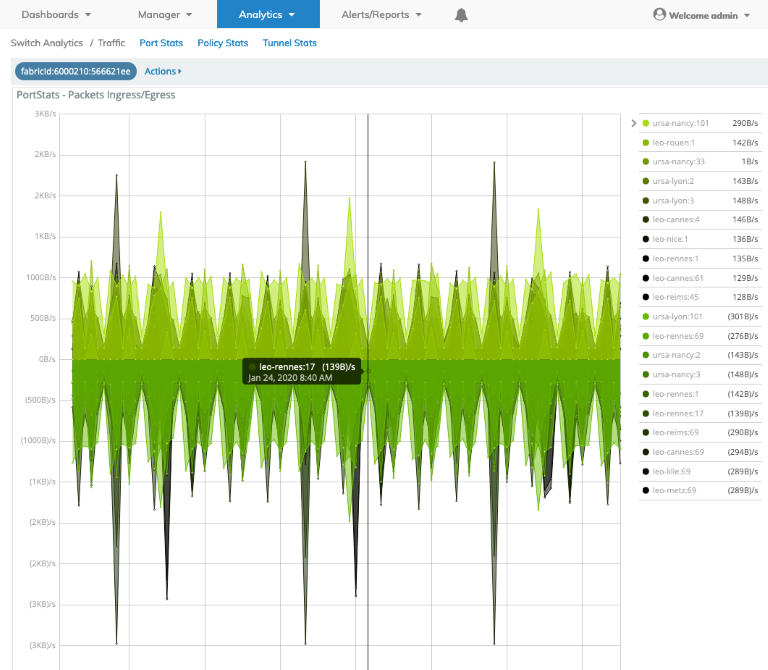
Switch Analytics Port Stats Widget Rollover
Clicking on a switch name listed in the legend further refines the widget dashboard providing detailed and specific ingress or egress information.
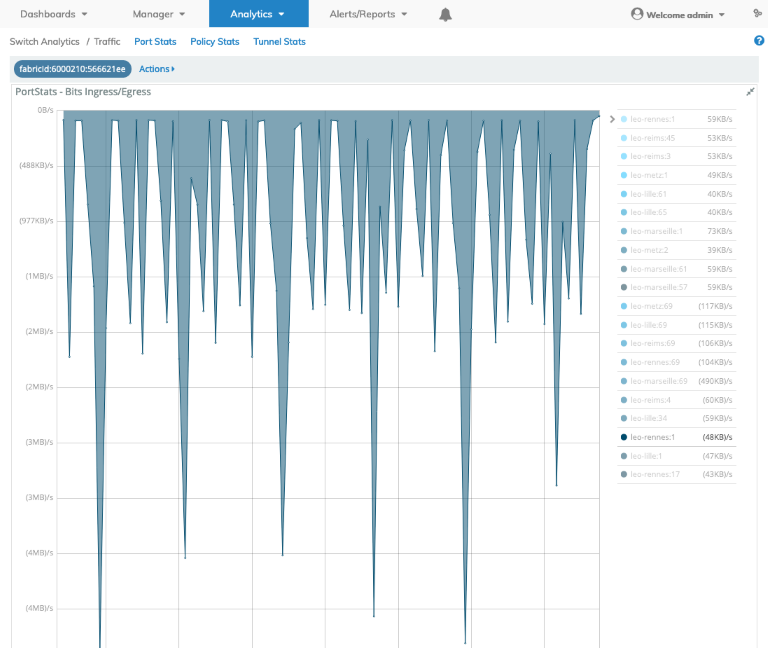
Switch Analytics Port Stats Widget Rollover by Switch
Port Traffic
Select a node switch from the Fabric to update the dashboard with Port Traffic data.
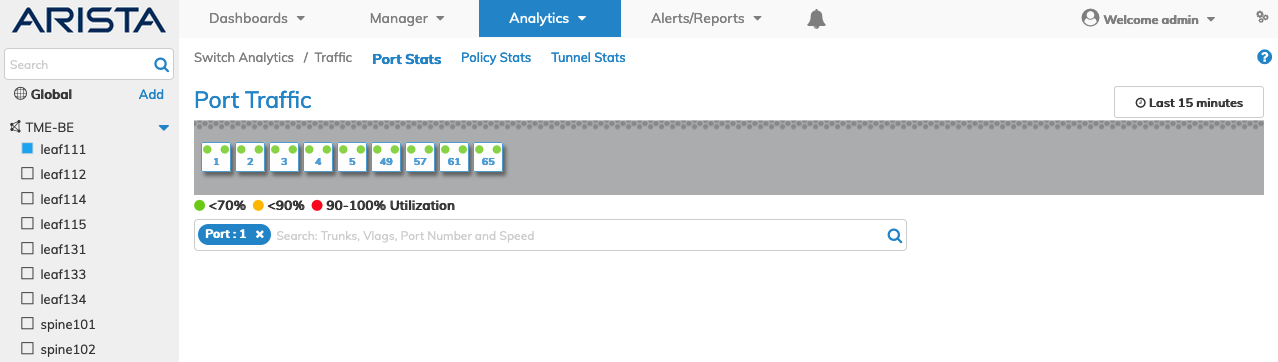
Switch Analytics Port Traffic Dashboard Default Display
The Port dashboard displays port traffic data by active port on the selected switch by selecting a port.
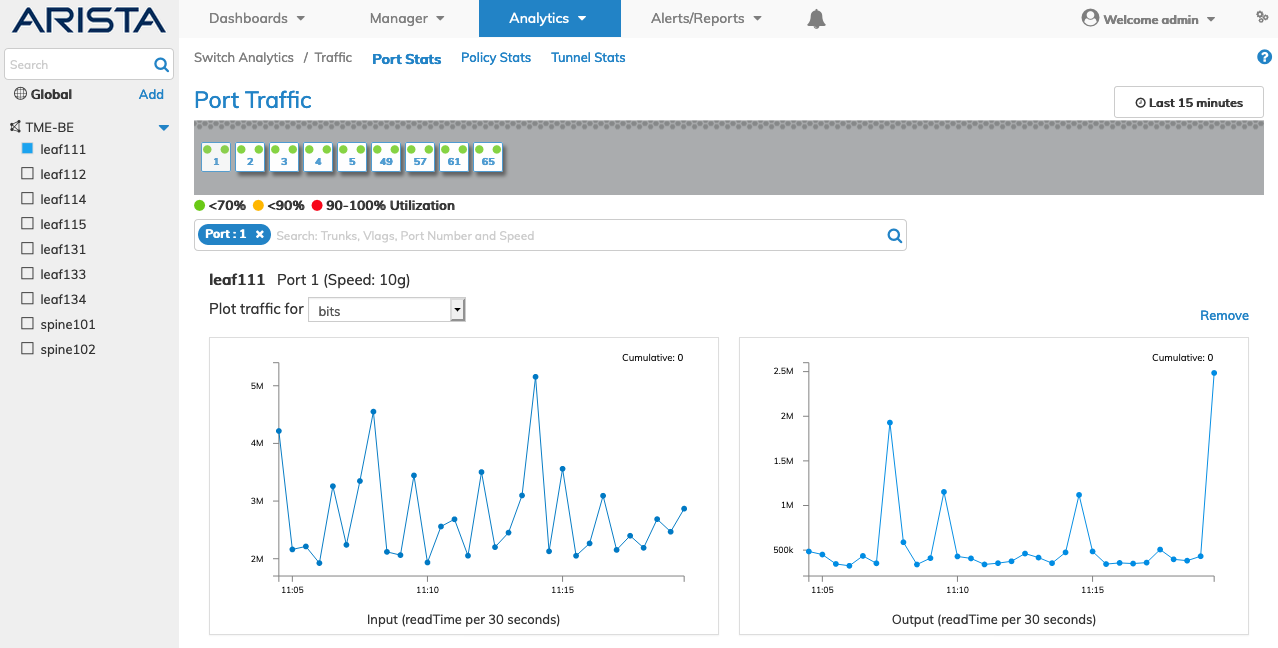
Switch Analytics Port Traffic Dashboard
You visually determine port traffic utilization using the color coded indicators on each port displayed ranging from Green (<70%) to Yellow (70 <90%) to Red (90-100%).
You select different display plots using the Plot traffic for drop-down menu.
Data display options include: pauseFrames, problemPackets, unicastPkts, bits, multicastPkts, discards, broadcastPkts, errors, packets and congestionDropPkts.
When selected the display automatically updates with the application data.
Clicking on additional ports adds that data to the dashboard display as shown below.
You remove the added plots by clicking on the associated Remove link.
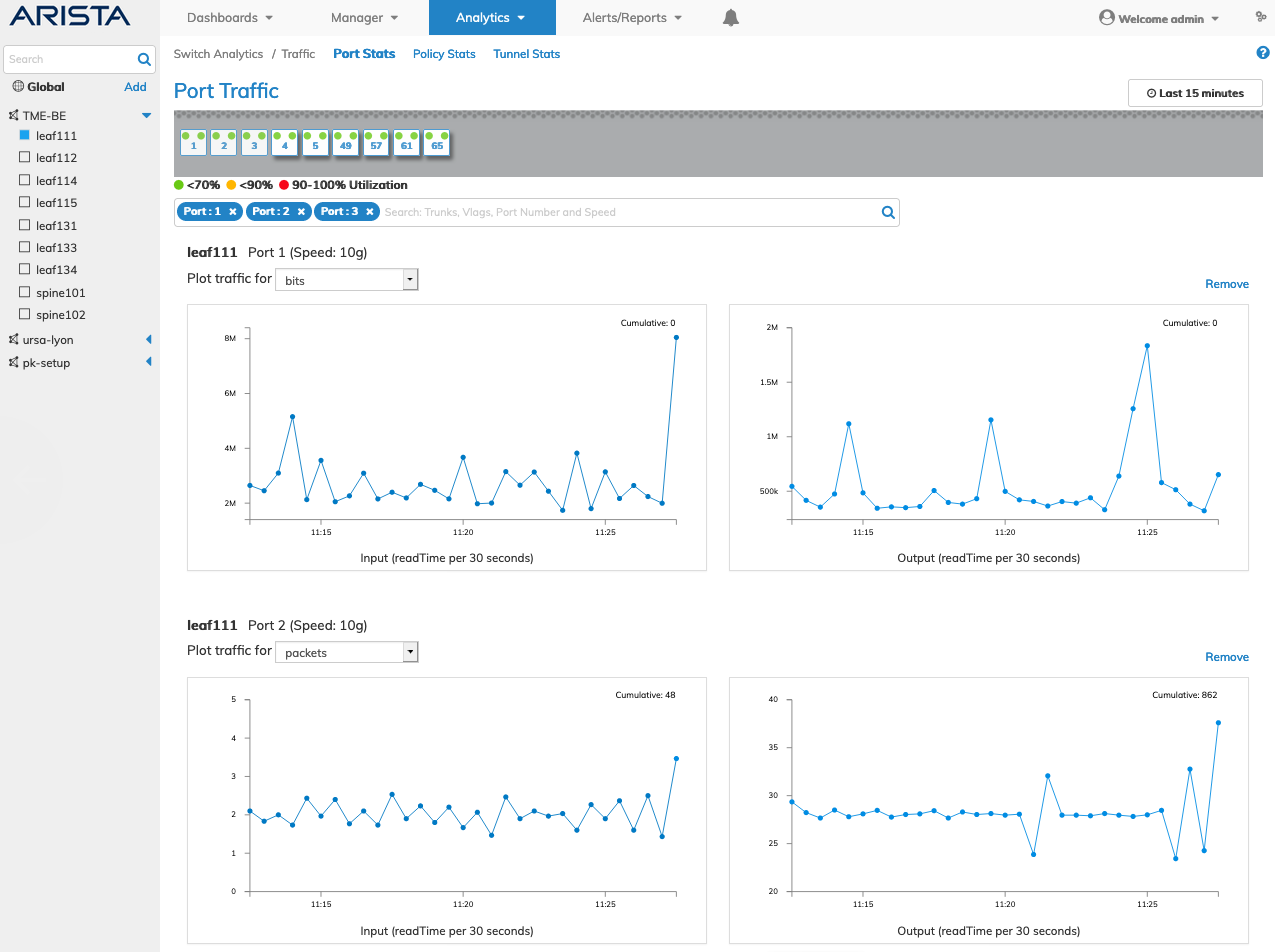
Switch Analytics Port Traffic Dashboard Multiple Ports
Select time ranges using the time range selector. Time ranges from 60 seconds to the Last 7 days.
|
|
|
|
Time Selector |
Time Range |
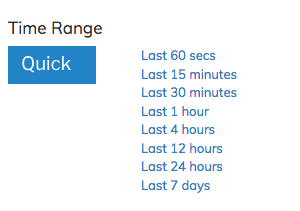
Switch Analytics Port Traffic Time Range
You search for Trunks, Vlags, Port Number, and Speed using the Search box.
The Port Traffic indicators automatically update based upon the port data found.
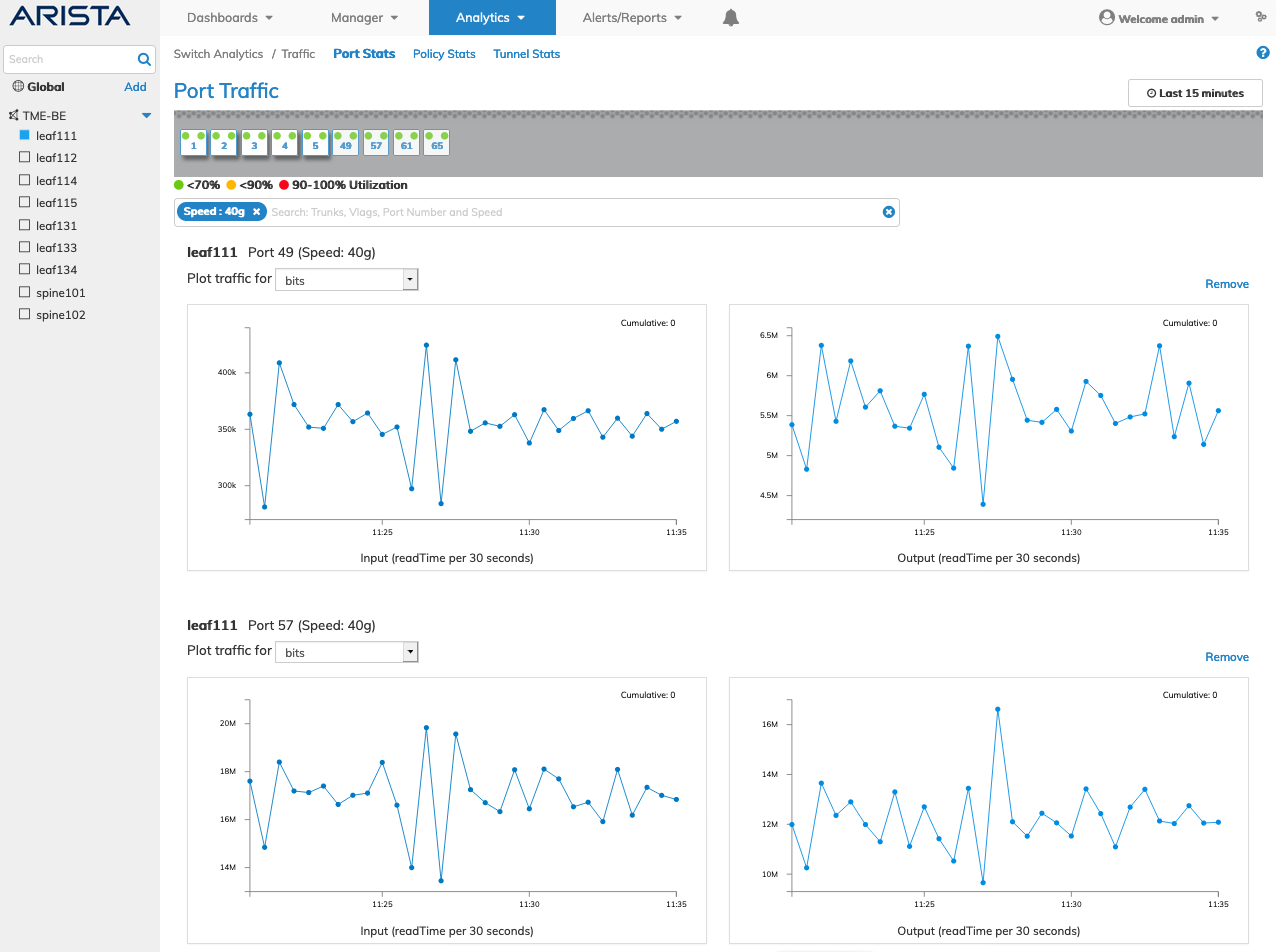
Switch Analytics Port Traffic Dashboard Search Results
Rolling over a data point provides detailed information
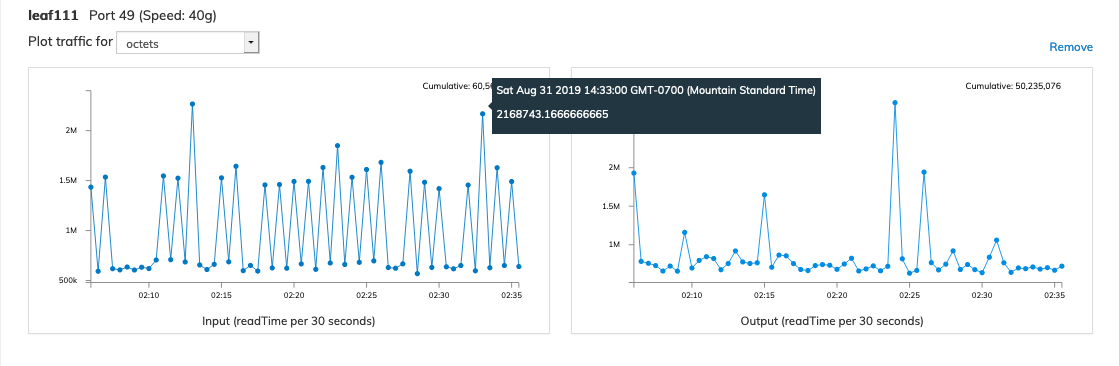
Switch Analytics Port Traffic Dashboard Search Results Data Point Rollover