
Database Health
Database Health
Selecting Menu Bar → ![]() → Database Health displays the Database Health dashboard. The Database Health tab highlights.
→ Database Health displays the Database Health dashboard. The Database Health tab highlights.
There are features and functions used in UNUM Manager and UNUM Analytics that are common throughout the user interface (UI). Please refer to the Common Functions section for more information on the use of these functions and features.
The UNUM Configuration Database Health module provides functionality to monitor health and performance of the overall system.
Select the Database Health to launch the monitoring window.
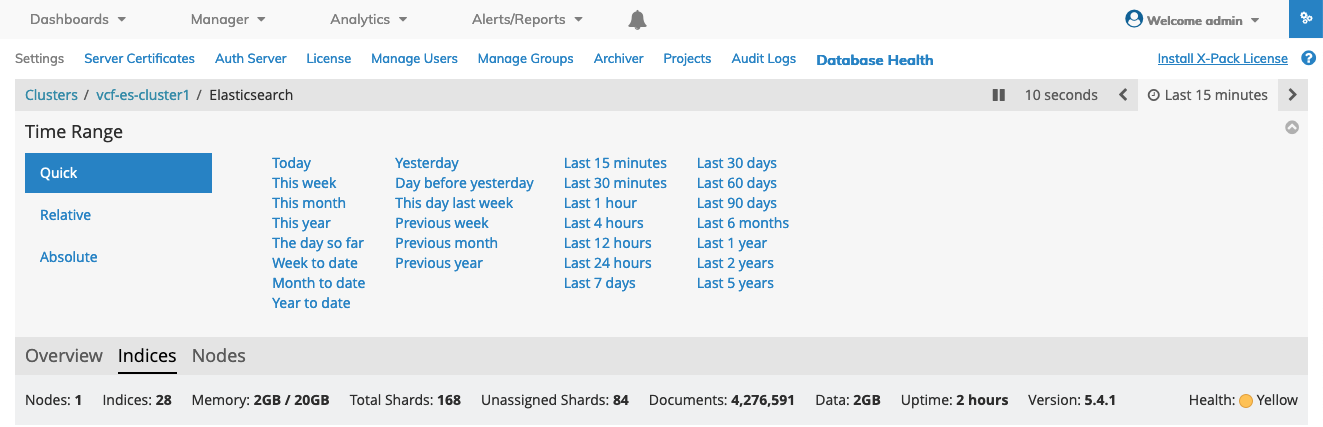
The dashboard shows an Overview of the health of the system as well as drill-down tabs for Indices and Nodes (clusters).
Pertinent information about each node includes:
•Number of Nodes
•Indices
•Memory Consumption
•Total number of Shards
•Unassigned Shards
•Documents
•Data Store
•Uptime
•Software Version
•Health Indicator (will always default to display yellow caution if only a single node is active)
As illustrated below system health status warnings are highlighted.
Search Rate, Search Latency, Indexing Rate, Index Latency, Shard Activity and other relevant data points are monitored by default and the associated graphs and charts provide visual feedback about the overall performance of the UNUM.
Dashboard

UNUM Configuration System Health Overview Dashboard
Data collection is stopped using the ![]() (Pause) icon and restarted using the
(Pause) icon and restarted using the ![]() (Play) icon.
(Play) icon.
To install the extended features X-Pack License follow the step described below and follow the on-screen instructions to register for a license and Upload the license to activate the X-Pack.
Installation Steps
1)Click the link: https://register.elastic.co/marvel_register
2)Provide your details and email address and you will receive an acknowledgment email: “Thank you for using the Elastic Stack and registering for your free Basic license! This license expires on… To download your license, please go to: http://license.elastic.co/registration/download/(data string) Best, The Elastic Team”
3)Click on the link provided in the email message.
4)Click Ok to accept the agreement.
5)Download the ElasticSearch 5.x license and save it as: lic.json
6)Go to https://UNUM_IP_Address/#/settings/health and click on Install XPack License.
7)Upload lic.json from the location where you saved the file.
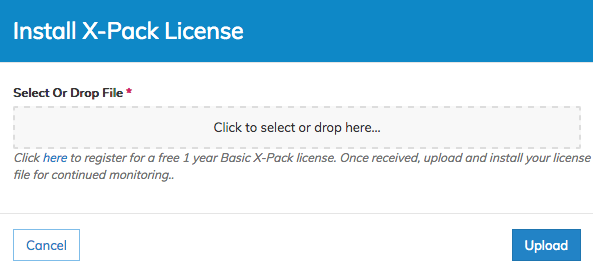
UNUM Configuration System Health Install X-Pack Register for License
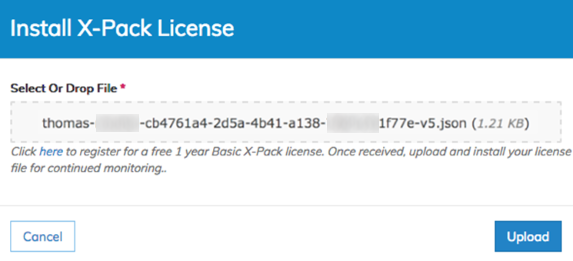
UNUM Configuration System Health X-Pack License Code
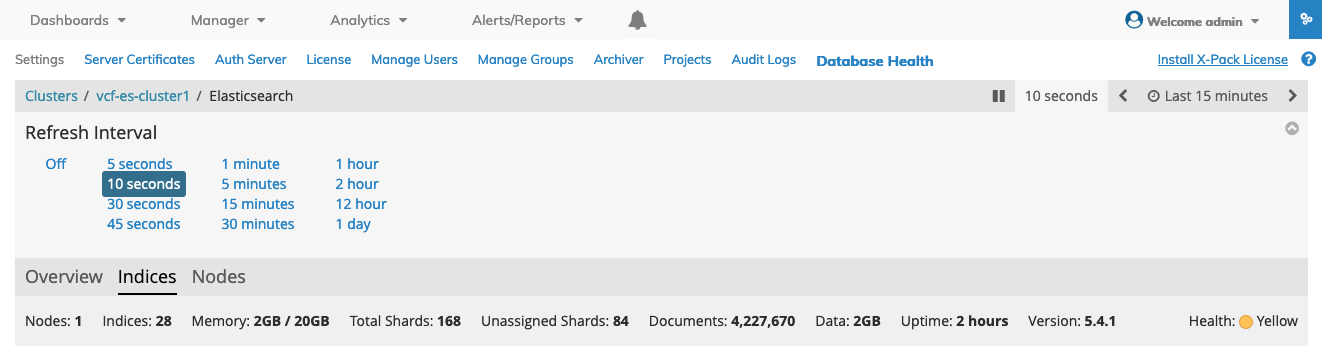
Refresh Interval
The information displayed is updated based on the selected sampling time by clicking on the Time link from 5 seconds to 24 hours (1 day).
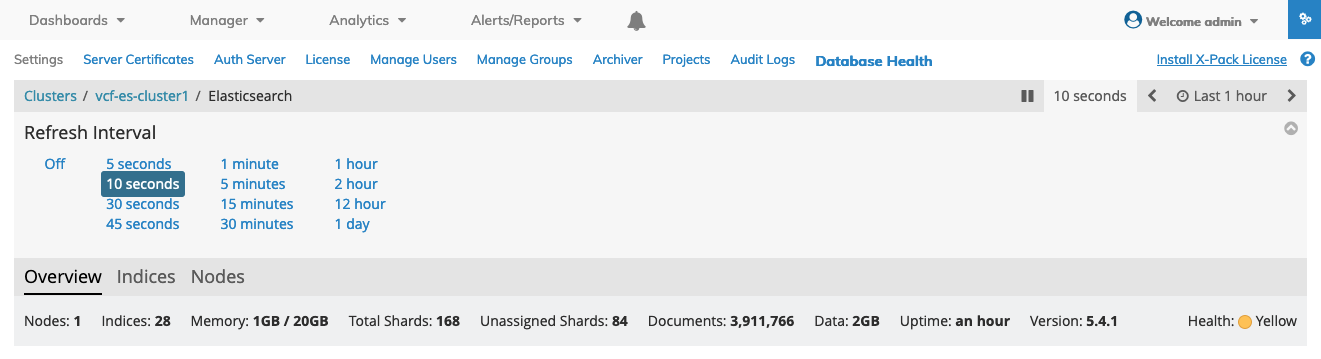
UNUM Configuration System Health Refresh Interval
Time Range
Alternately, turn off updates as applicable.
Historical information is displayed by clicking on the Time (Last) icon and can display information from current day up to the last 5 years.
The updated time sampling and historical selection is displayed in the tool bar.
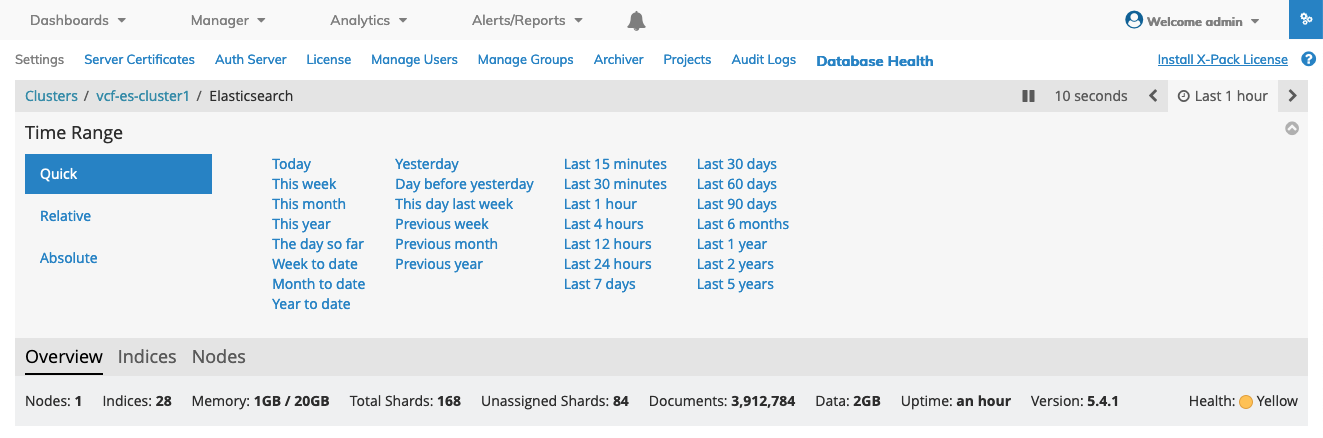
UNUM Configuration System Health Time Range
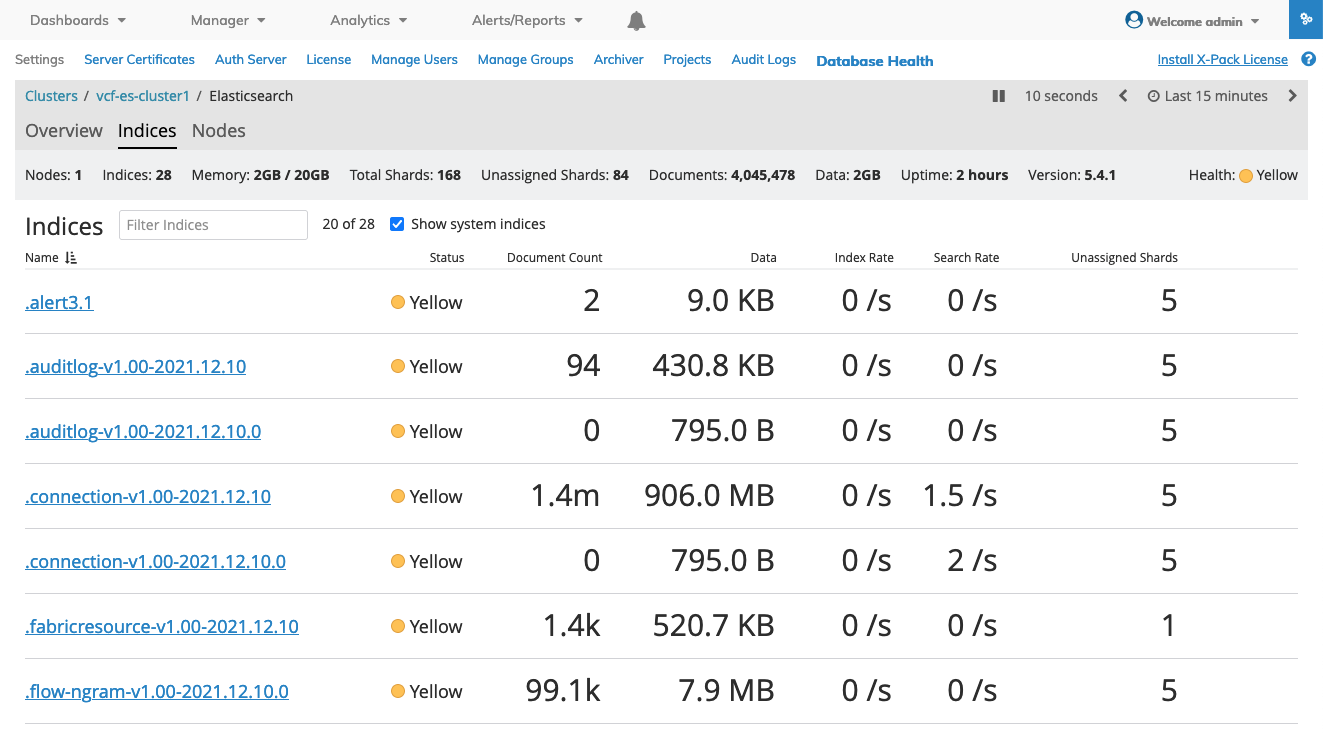
System Health Indices
More granular information is available by clicking on the Indices Tab. Select the checkbox Show System Indices to view all UNUM indices.
Associated graphs and charts provide visual feedback about the overall performance of the UNUM system.
The information displayed is updated based on the selected sampling time by clicking on the Time link from 5 seconds to 24 hours.
Alternately, turn off updates as applicable.
Historical information is displayed by clicking on the Last (time) icon. Display information from current day up to the last 5 years.
The updated time sampling and historical selection is displayed in the tool bar.
Data collection is stopped using the ![]() (Pause) icon and restarted using the
(Pause) icon and restarted using the ![]() (Play) icon.
(Play) icon.
UNUM Configuration System Health Time Range Indices
You drill-down further into the Indices by selecting any one of the links displayed on the dashboard.
The dashboard then updates with more granular information.
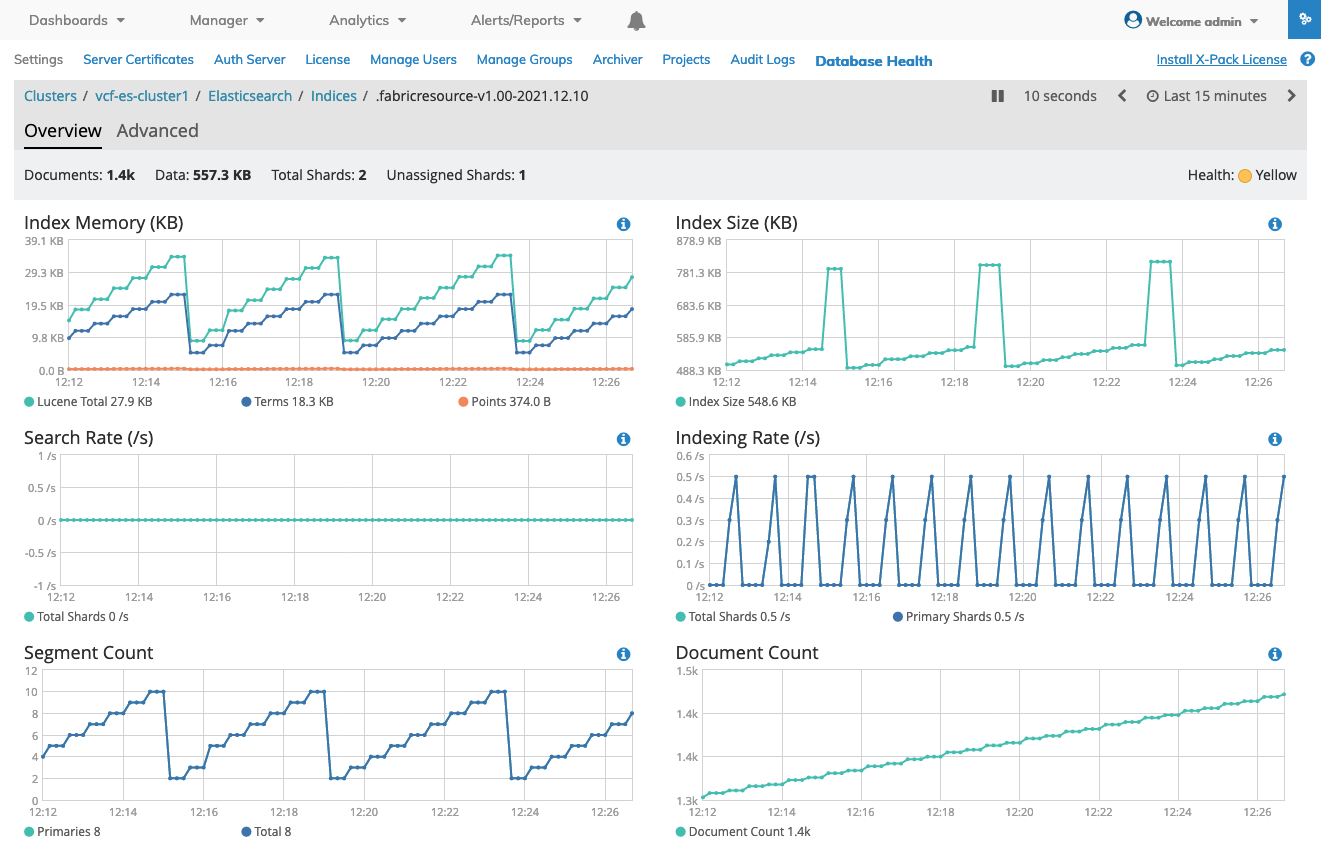
UNUM Configuration System Health Indices Drill-down Overview
Additional Indices information is available selecting the Advanced feature.
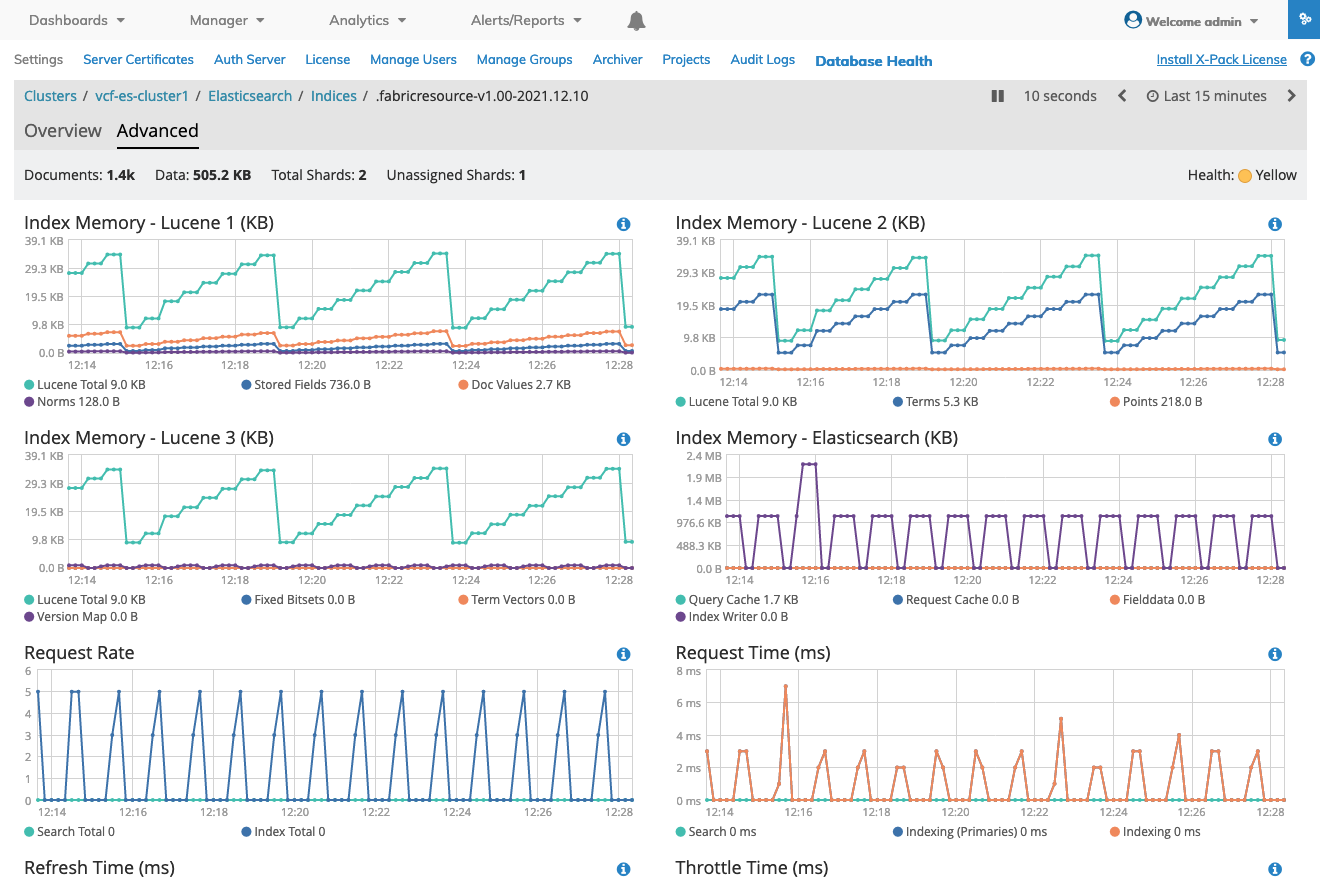
UNUM Configuration System Health Drill-down Advanced Tab
System Health Indices over Time
UNUM Configuration System Health Indices
Data Node Indices Historical Information
UNUM Configuration System Health Historical Information
Data Node Indices Drill-down
Quick, Relative and Absolute time drill-down monitoring is achieved by selecting the appropriate icon.
The Quick method displays data from current day up to the last 5 years.
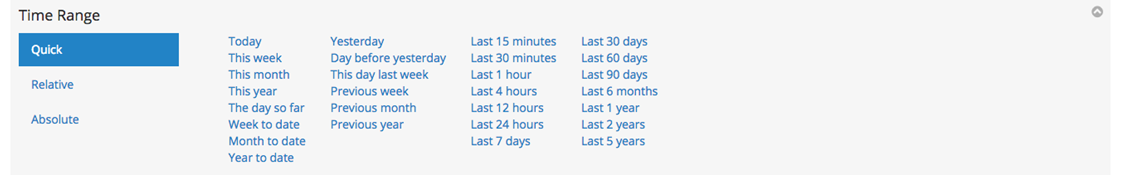
UNUM Configuration System Health Quick Date Drill-down
The Relative and Absolute methods provide a finer level of granularity for selecting data from specific date ranges as illustrated below.
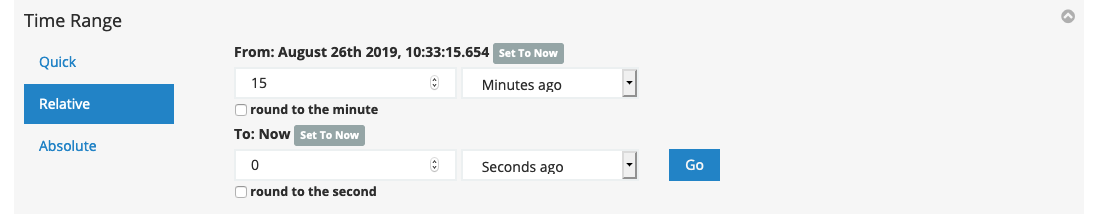
UNUM Configuration System Health Relative Date Range Drill-down
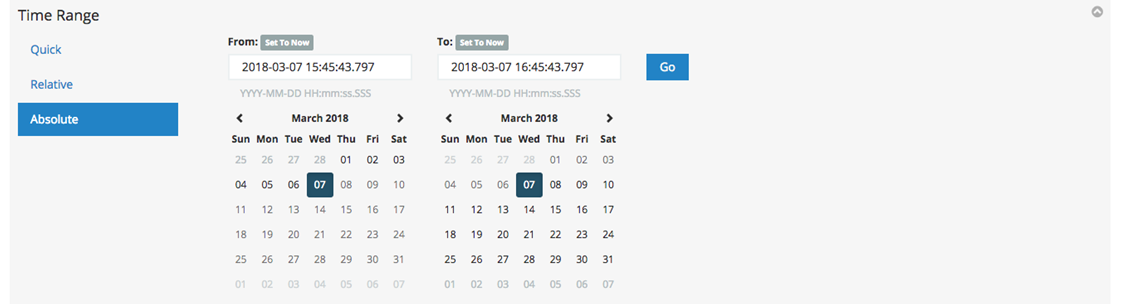
UNUM Configuration System Health Absolute Date Range Drill-down
System Health Nodes
More granular information listing individual Nodes is available by clicking on the Nodes Tab.
Associated graphs and charts provide visual feedback about the overall performance of the UNUM system.
The information displayed is updated based on the selected sampling time by clicking on the Time link from 5 seconds to 24 hours.
Alternately, turn off updates as applicable.
Historical information is displayed by clicking on the Last (time) icon. Display information from current day up to the last 5 years.
The updated time sampling and historical selection is displayed in the tool bar.
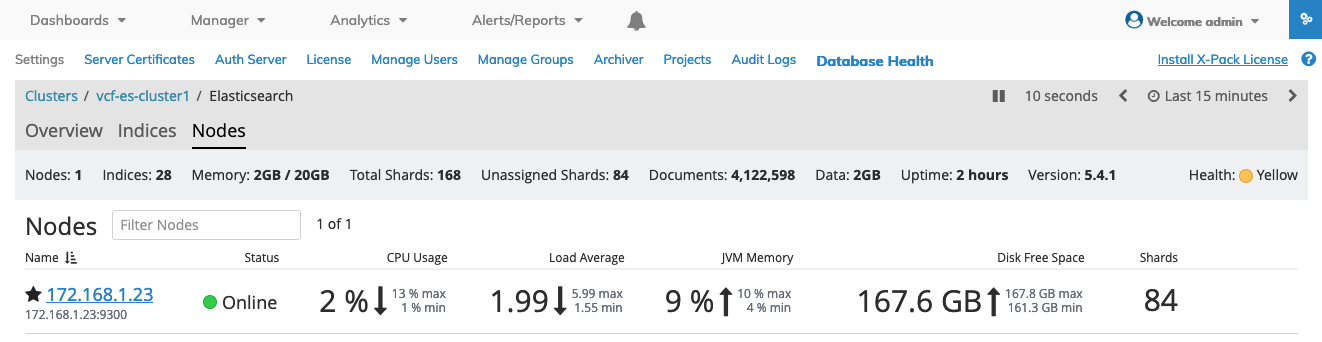
UNUM Configuration System Health Data Node Dashboard
Similar to the workings of Indices Tab (see Data Nodes Indices Drill-down above) clicking on the Time link from 5 seconds to 24 hours or the Last (time) icon brings up the same data drill-down interface along with the Quick, Relative and Absolute time drill-downs (see Data Nodes Indices Drill-down above).
The Quick method displays data from current day up to the last 5 years. While the Relative and Absolute methods provide a finer level of granularity for selecting data from specific date ranges (see Data Nodes Indices Drill-down above).
Data collection is stopped using the ![]() (Pause) icon and restarted using the
(Pause) icon and restarted using the ![]() (Play) icon.
(Play) icon.
You click on an entry in the dashboard to drill-down further to see more granular information about the Node.
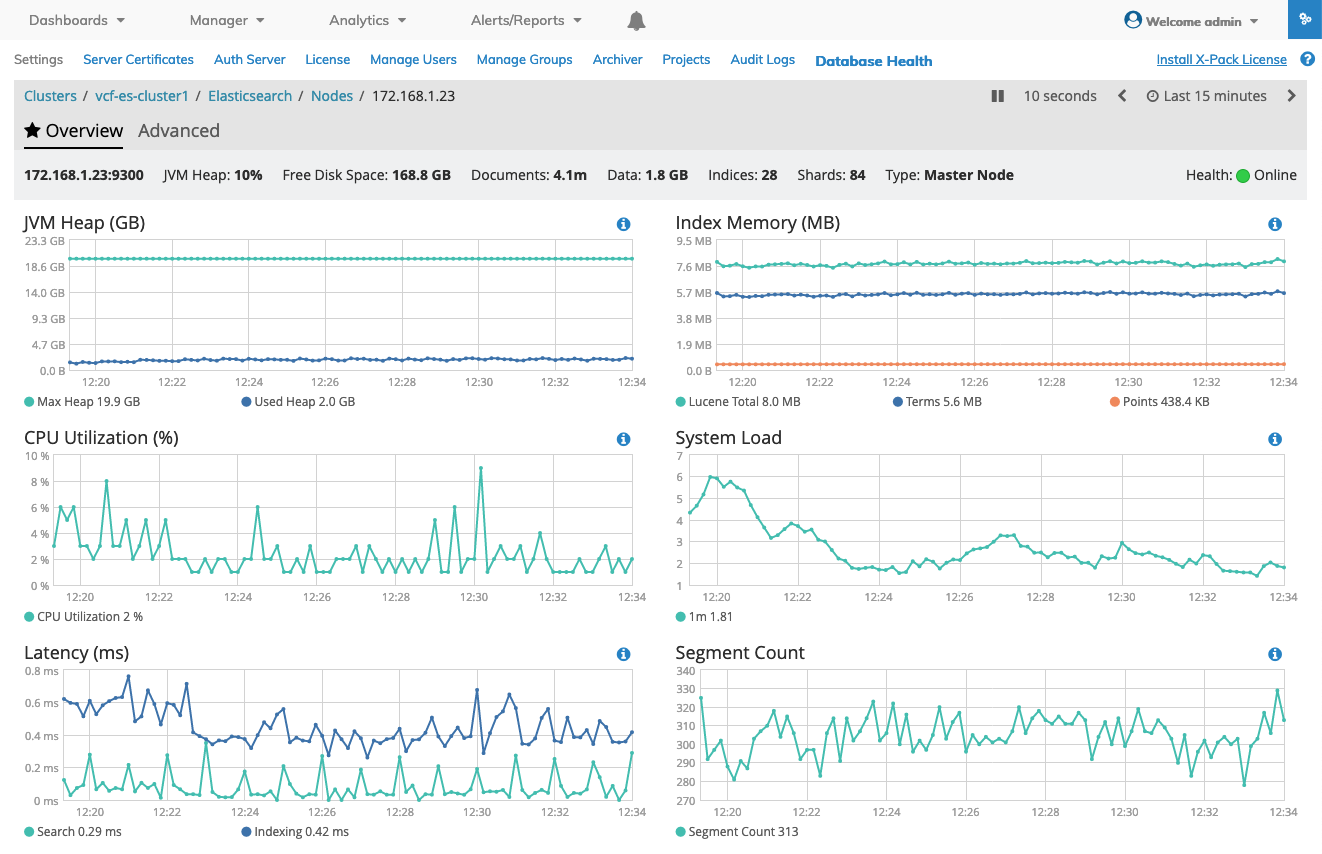
UNUM Configuration System Health Data Node Drill-down
Click on the Advanced tab to obtain more granular information about the Node.
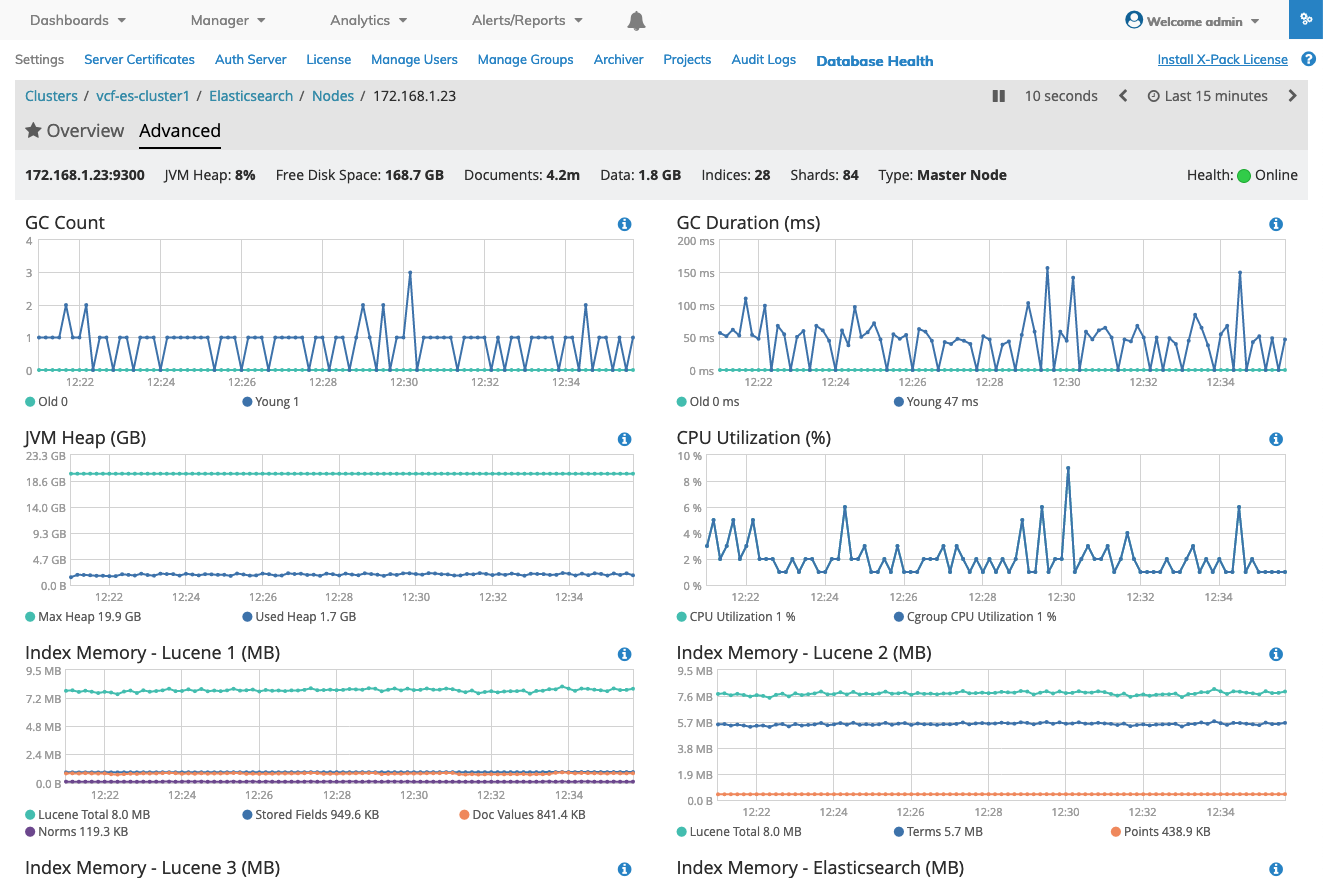
UNUM Configuration System Health Data Node Advanced Drill-down
Note: Additional information on using and configuring UNUM Database Health is available at Elastic.