Audit Logs
Audit Logs
Selecting Menu Bar → ![]() → Audit Logs displays the Audit Logs dashboard. The Audit Logs tab highlights.
→ Audit Logs displays the Audit Logs dashboard. The Audit Logs tab highlights.
There are features and functions used in UNUM Manager and UNUM Analytics that are common throughout the user interface (UI). Please refer to the Common Functions section for more information on the use of these functions and features.
The UNUM Configuration Audit Logs module provides a convenient method of reviewing log events from UNUM instances.
All UNUM Manager configuration actions are captured in the Audit Log.
Usage Note: Before collecting any analytics, add a Fabric and install and activate a valid license.
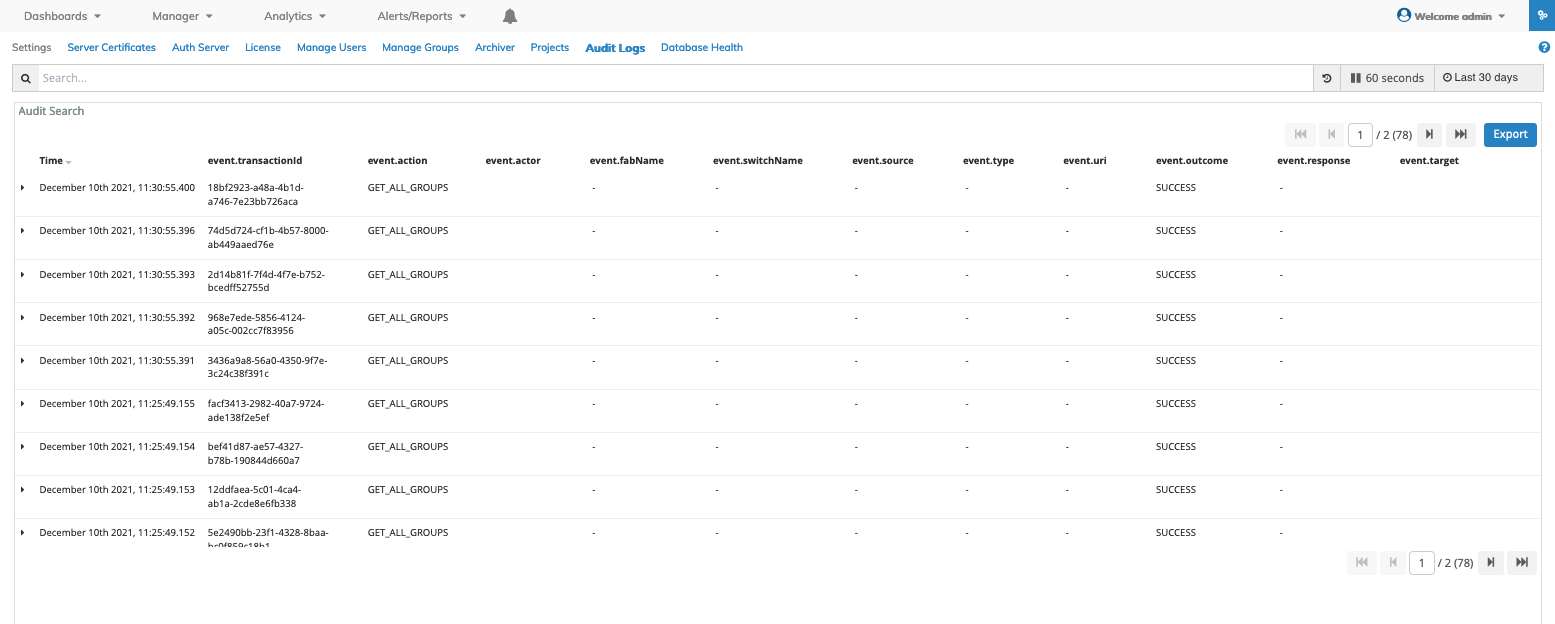
The dashboard displays a list of log events . Log event details include:
•Time – date and timestamp of the event.
•event.transactionid – unique transaction ID number.
•event.action – for example. LOGIN or LOGOUT or vREST API GET/POST/PUT/ DELETE calls.
•event.actor – user account name associated with the event.
•event.fabname – name of the fabric where the event occurred.
•event.switchName – name of the switch where the event occurred such as a seed switch.
•event.source – source IP address of event.
•event.type – type of event, associated with event.action.
•event.uri – Uniform Resource Identifier for the event, captures vREST API uri.
•event.outcome – outcome status for the event.
•event.response – captures vREST API response.
•event.target – payload of the event.

Audit Logs Dashboard
You sort the list of entries in the dashboard using Time to display new or older events.
Viewing Document Context
For certain applications it is often useful to inspect a window of documents surrounding a specific event. The context view enables you to do just that for index patterns that are configured to contain time-based events.
To show the context surrounding an anchor document, click the![]() Expand Button to the left of the document table entry and then click the View surrounding documents link.
Expand Button to the left of the document table entry and then click the View surrounding documents link.
Note: Additional information on using and configuring UNUM Audit Logs is available at Elastic.
