
Flow - Dynamic Flow Mapping
Insight Analytics Flow Dynamic Flow Mapping (DFM)
There are features and functions used in UNUM Manager and UNUM Analytics that are common throughout the user interface (UI). Please refer to the Common Functions section for more information on the use of these functions and features.
Selecting Analytics → Insight Analytics Flow → DFM displays the DFM dashboard. The DFM tab highlights.
The DFM tab highlights.
Usage Note: Before any analytics are collected, add a Fabric and install and activate a valid license.
Overall, the UNUM Insight Analytics Flow DFM tab displays the following information:
•Top Switches by Total # of Connection – displays the top switches by total number of connections by switch name.
•Insight – Connections Timeline by State – displays connection timeline by State (FIN, RST, SYN, SYN-ACK, etc.).
•Insight – Connections Count – displays total number of connections.
•Total Client Endpoints – displays total number of client endpoints by unique count of srcIP.
•Srcip to dstip Dependencies – srcIP to dstIP graphic.
•Insight Details – tabular data of each connection.
The upper DFM dashboard widgets include:
•Top Switches by Total # of Connection – displays the top switches by total number of connections by switch name.
•Insight – Connections Timeline by State – displays connection timeline by State (FIN, RST, SYN, SYN-ACK, etc.).
•Insight – Connections Count – displays total number of connections.
•Total Client Endpoints – displays total number of client endpoints by unique count of srcIP.
•Srcip to dstip Dependencies – srcIP to dstIP graphic.
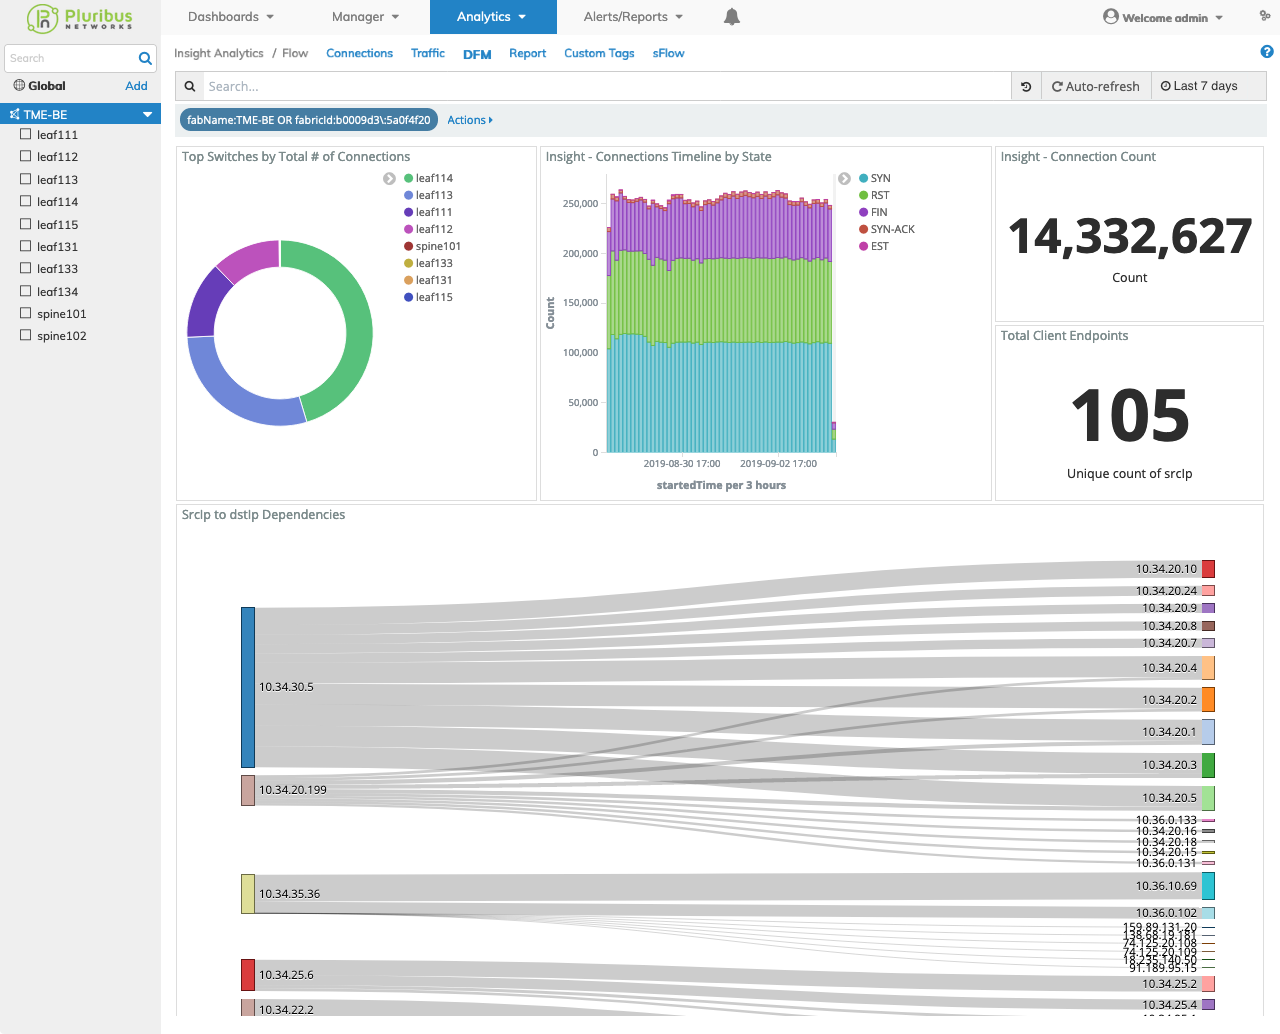
Insight Analytics Flow Dynamic Flow Mapping Upper Dashboard
The lower DFM dashboard widgets include:
•Insight Details – tabular data of each connection.
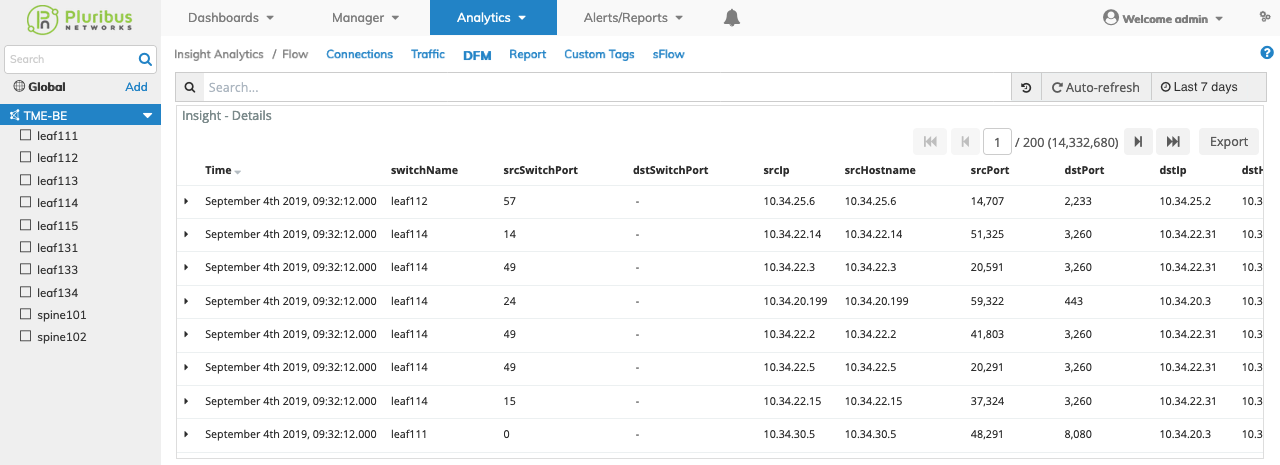
Insight Analytics Flow Dynamic Flow Mapping Lower Dashboard
Selecting a Switch within the Fabric automatically updates the Insight Analytics DFM dashboard with information from the selected switch.
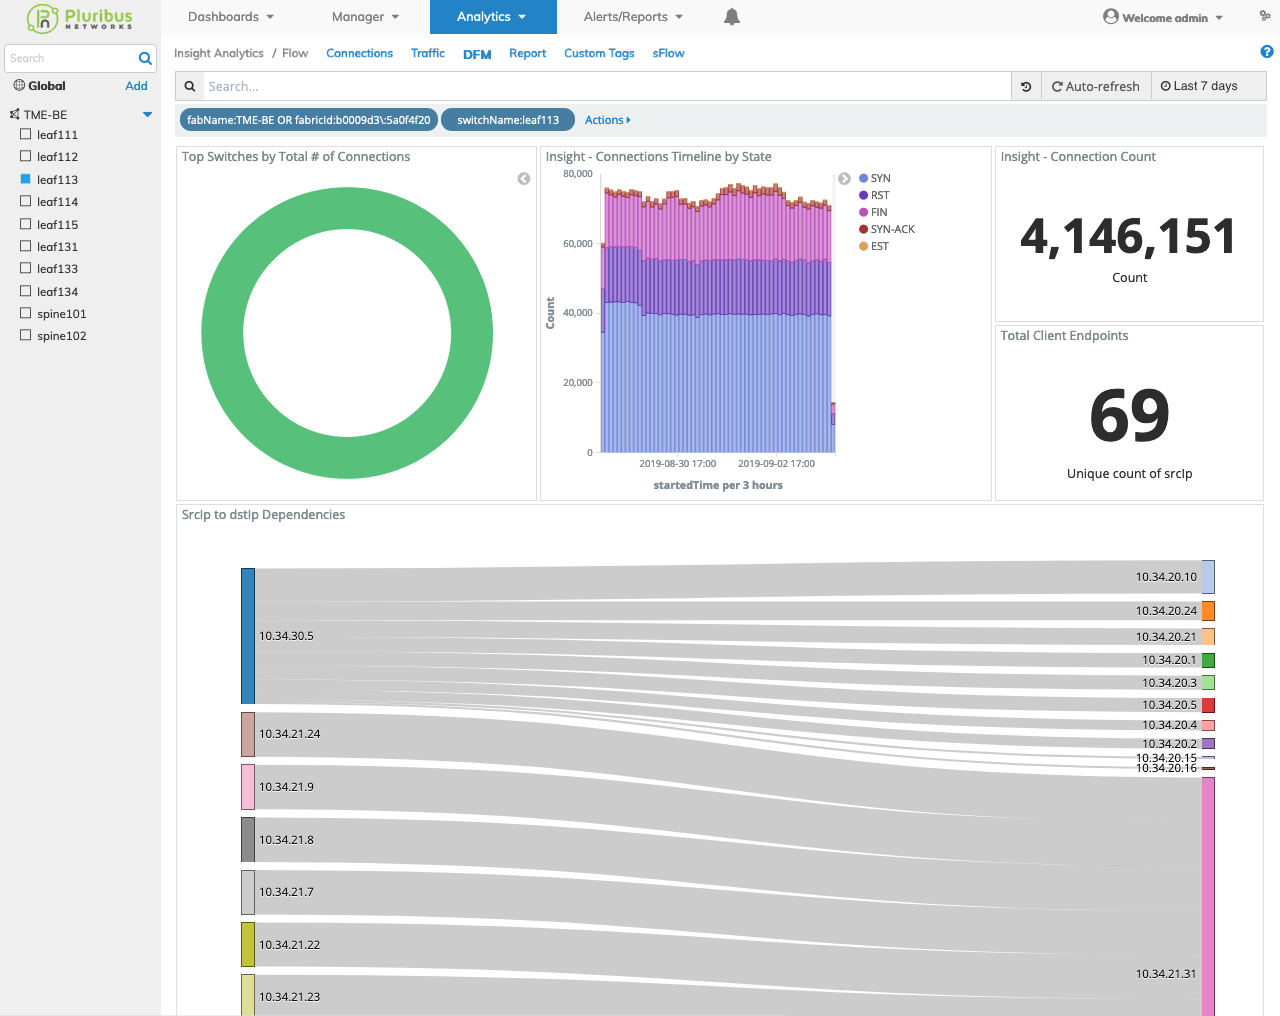
Insight Analytics Flow Dynamic Flow Mapping Switch Dashboard
Source IP to Destination IP Mapping Graphic
The srcIP to dstIP Dependencies graphic provides extensive data drill-down functionality. By clicking on a data flow the Insight Details table is updated with specific details concerning the connection.
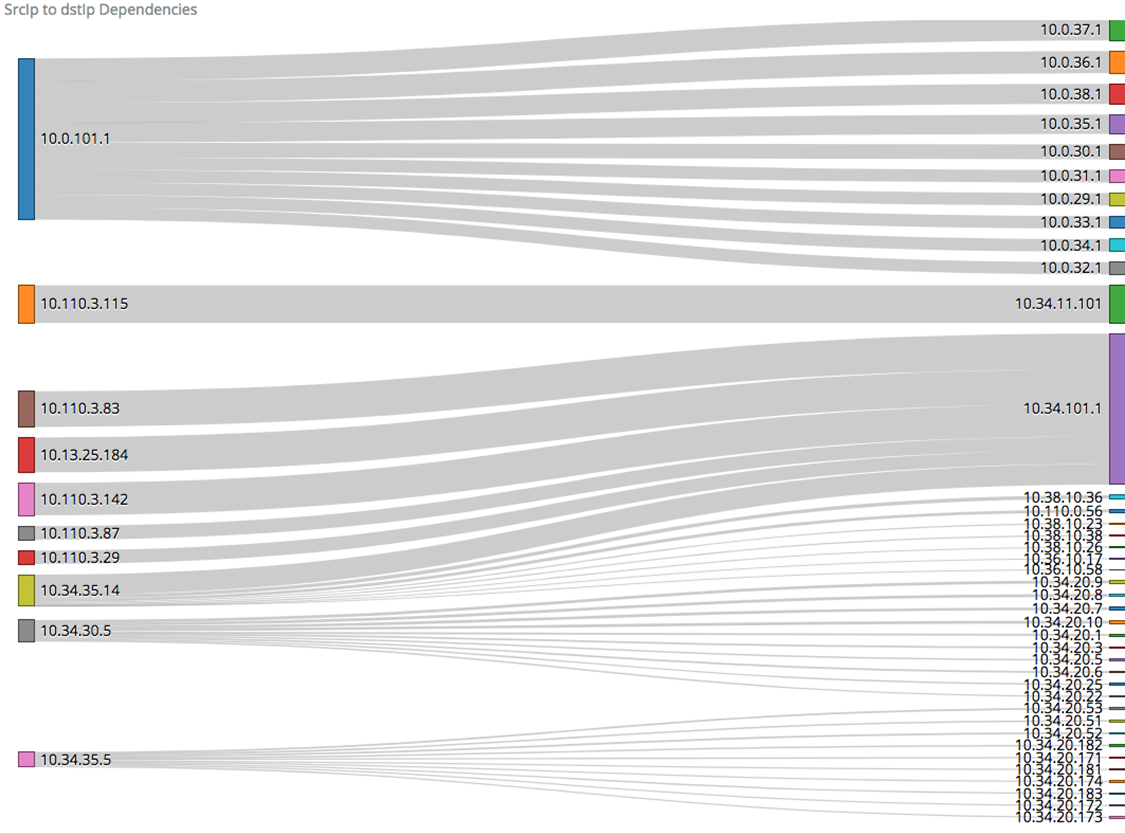
Insight Analytics Flow Dynamic Flow Mapping Source IP to Destination IP Mapping
Insight Analytics Flow General Features
Data drill-down, widget interaction, search and filtering functions work in a similar manner as described under the Insight Analytics Flow General Features section.