
Flow - Report
Insight Analytics Flow Report
There are features and functions used in UNUM Manager and UNUM Analytics that are common throughout the user interface (UI). Please refer to the Common Functions section for more information on the use of these functions and features.
Selecting Analytics → Insight Analytics Flow → Report displays the Report dashboard. The Report tab highlights.
Usage Note: Before any analytics are collected, add a Fabric and install and activate a valid license.
The UNUM Insight Analytics Flow Report module aggregates daily flow statistics over the selected time in a rolling window.
The time is adjustable from 15 minutes to Previous Year.
Interval Selector ranges from Off to 2 hours.
Aggregated daily statistics include:
•Capacity - Daily Total Connections – displays the number of total network connections per day.
•Capacity - Daily Unique L4 Services – the number of unique applications connecting on the network.
•Capacity - Daily Unique Client Devices – the number of unique client devices connecting to the network.
•Capacity - Port Traffic (Bytes) – the amount of traffic flowing through the ports measured in bytes.
•Capacity - Overall Port Packet Errors – the number of packet errors occurring on the ports.
•Capacity - Port Traffic (Packets) – the amount of packet traffic flowing through the ports.
•Capacity - Weekly L4 Services – the top applications that clients are connecting to on the network.
•Capacity - Weekly Top Clients – the top clients connecting to the network.
•Capacity - Weekly Top Servers – the top servers connecting to clients on the network.
•Capacity - Hourly Connection Activity – the number of connections on the network per hour.
•Capacity - Hourly Port Traffic (Bytes) – the amount of traffic flowing through the switch per hour in bytes.
•Capacity - Hourly Port Traffic (Packets) – the number of packets flowing through the switch per hour.
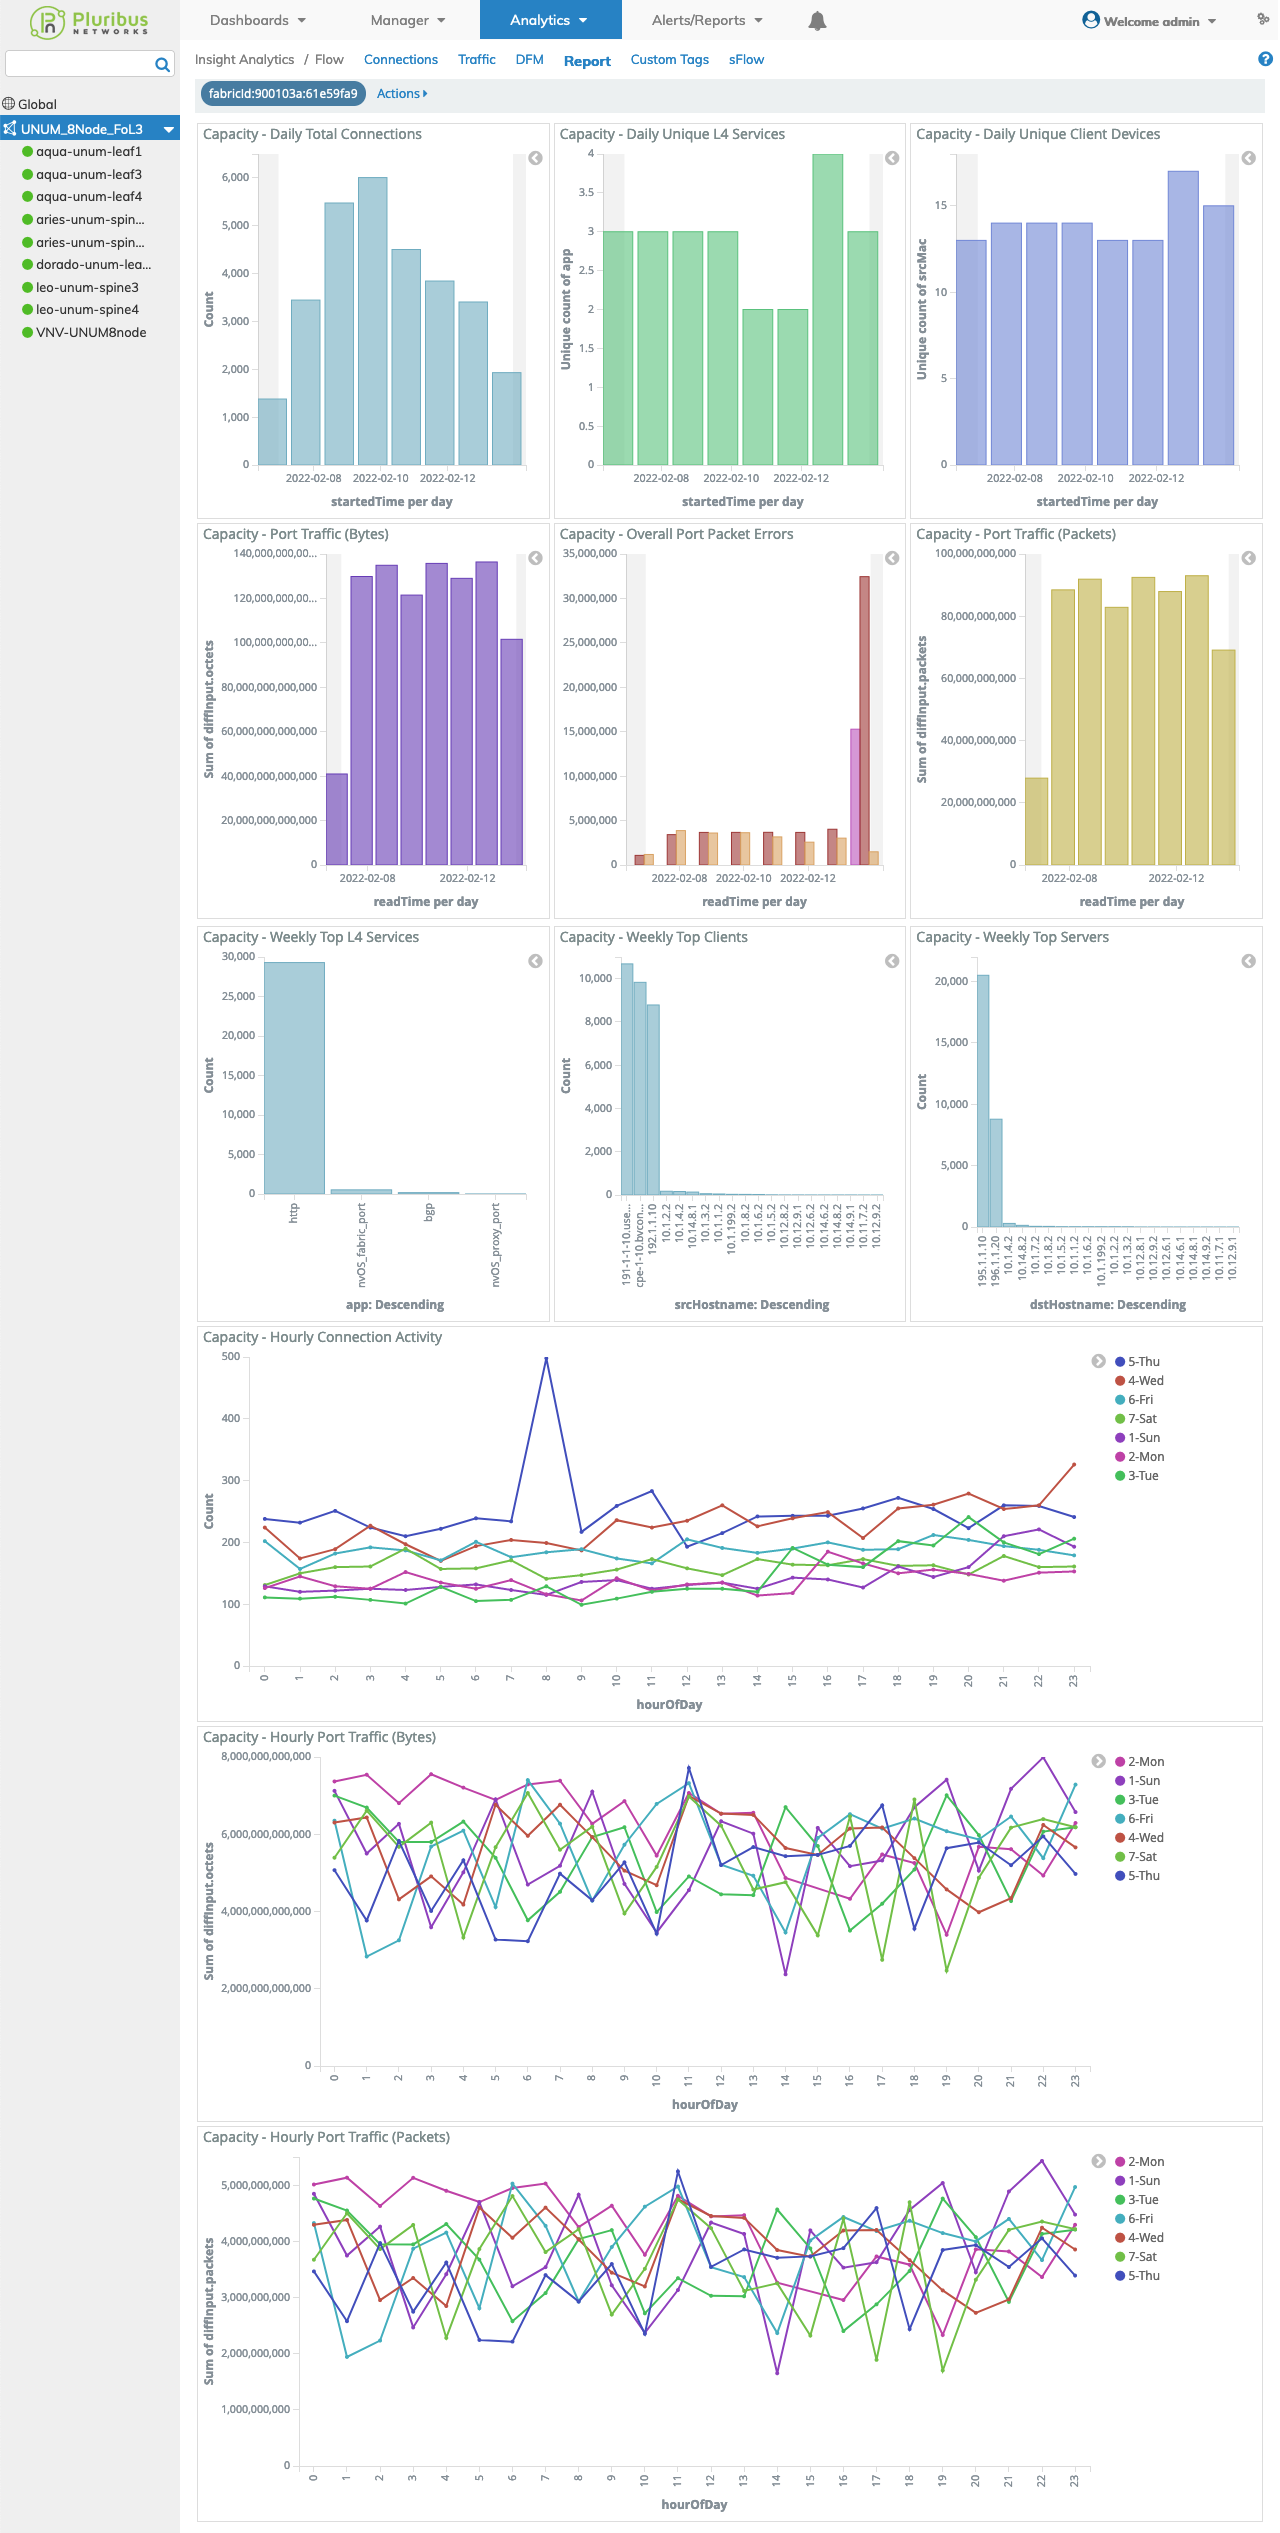
Insight Analytics Flow Report Dashboard
Selecting a Switch within the Fabric automatically updates the Insight Analytics Report dashboard with information from the selected switch.
The Report module also supports global filters by clicking on any of the chart items.
You drill-down into the data by selecting any chart item in the dashboard and clicking on an area of interest.
Insight Analytics Flow General Features
Data drill-down, widget interaction, search and filtering functions work in a similar manner as described under the Insight Analytics Flow General Features section.