
Flow - Traffic
Insight Analytics Flow Traffic
There are features and functions used in UNUM Manager and UNUM Analytics that are common throughout the user interface (UI). Please refer to the Common Functions section for more information on the use of these functions and features.
Selecting Analytics → Insight Analytics Flow → Traffic displays the Flow Traffic dashboard.
The Traffic tab highlights.
Usage Note: Before any analytics are collected, add a Fabric and install and activate a valid license.
Overall, the UNUM Insight Analytics Flow Traffic tab displays the following information:
•Top L4 Services by Bytes – displays the quantity of traffic by types such as https, http, etc.
•Top Clients by Bytes – displays the top client traffic in bytes by host name.
•Insight - L4 Services Count – unique counts of L4 services.
•Total Connection Byte Count – sum count of total bytes.
•Insight - Bytes by State – displays the number of bytes in a state.
•Insight - Top Servers by Bytes – displays the server with the highest number of connections in descending order.
•Top Servers by Average Total Bytes (for FIN/RST) – displays the top servers with the average total bytes in the state of FIN or RST.
•Top Clients by Average Total Bytes (for FIN/RST) – displays the top clients with the average total bytes in the state of FIN or RST.
•Insight - Top Server Domains by Bytes – displays the top server domains with the number of bytes in a state.
•Insight - Top Switches by Bytes – displays the switches with the highest traffic.
•Top Servers by Connection in RST state and 0 bytes – displays the top servers in the specified state.
•Insight - Details – data drill-down of connection and switch information.
The upper Traffic dashboard widgets include:
•Top L4 Services by Bytes – displays the quantity of traffic by types such as https, http, etc.
•Top Clients by Bytes – displays the top client traffic in bytes by host name.
•Insight - L4 Services Count – unique counts of L4 services.
•Total Connection Byte Count – sum count of total bytes.
•Insight - Bytes by State – displays the number of bytes in a state.
•Insight - Top Servers by Bytes – displays the server with the highest number of connections in descending order.
•Top Servers by Average Total Bytes (for FIN/RST) – displays the top servers with the average total bytes in the state of FIN or RST.
•Top Clients by Average Total Bytes (for FIN/RST) – displays the top clients with the average total bytes in the state of FIN or RST.
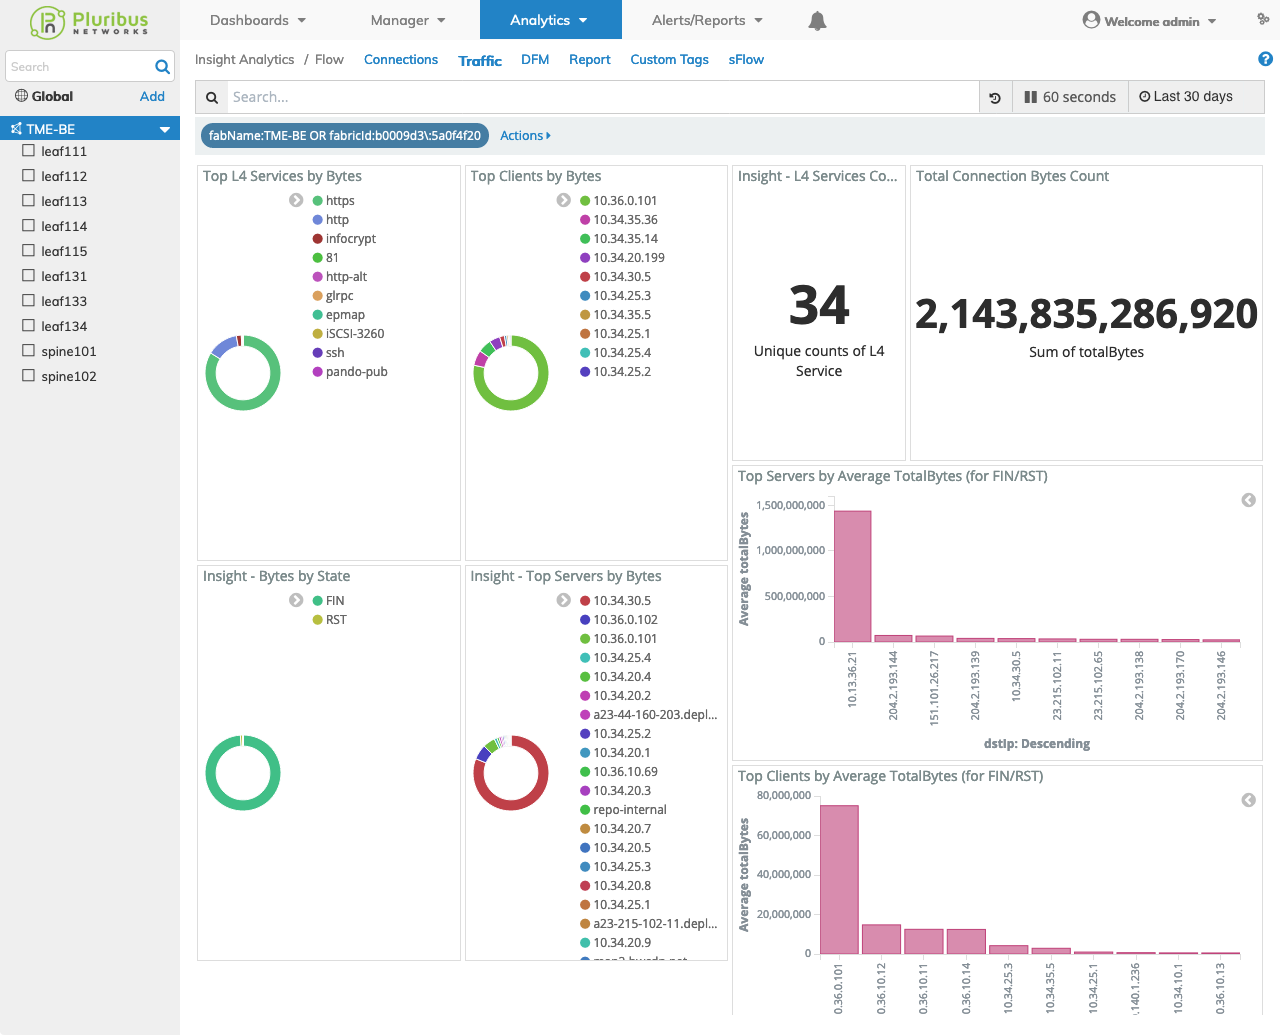
Insight Analytics Flow Traffic Details Upper Dashboard
The lower Traffic dashboard widgets include:
•Insight - Top Server Domains by Bytes – displays the top server domains with the number of bytes in a state.
•Insight - Top Switches by Bytes – displays the switches with the highest traffic.
•Top Servers by Connection in RST state and 0 bytes – displays the top servers in the specified state.
•Insight - Details – data drill-down of connection and switch information.
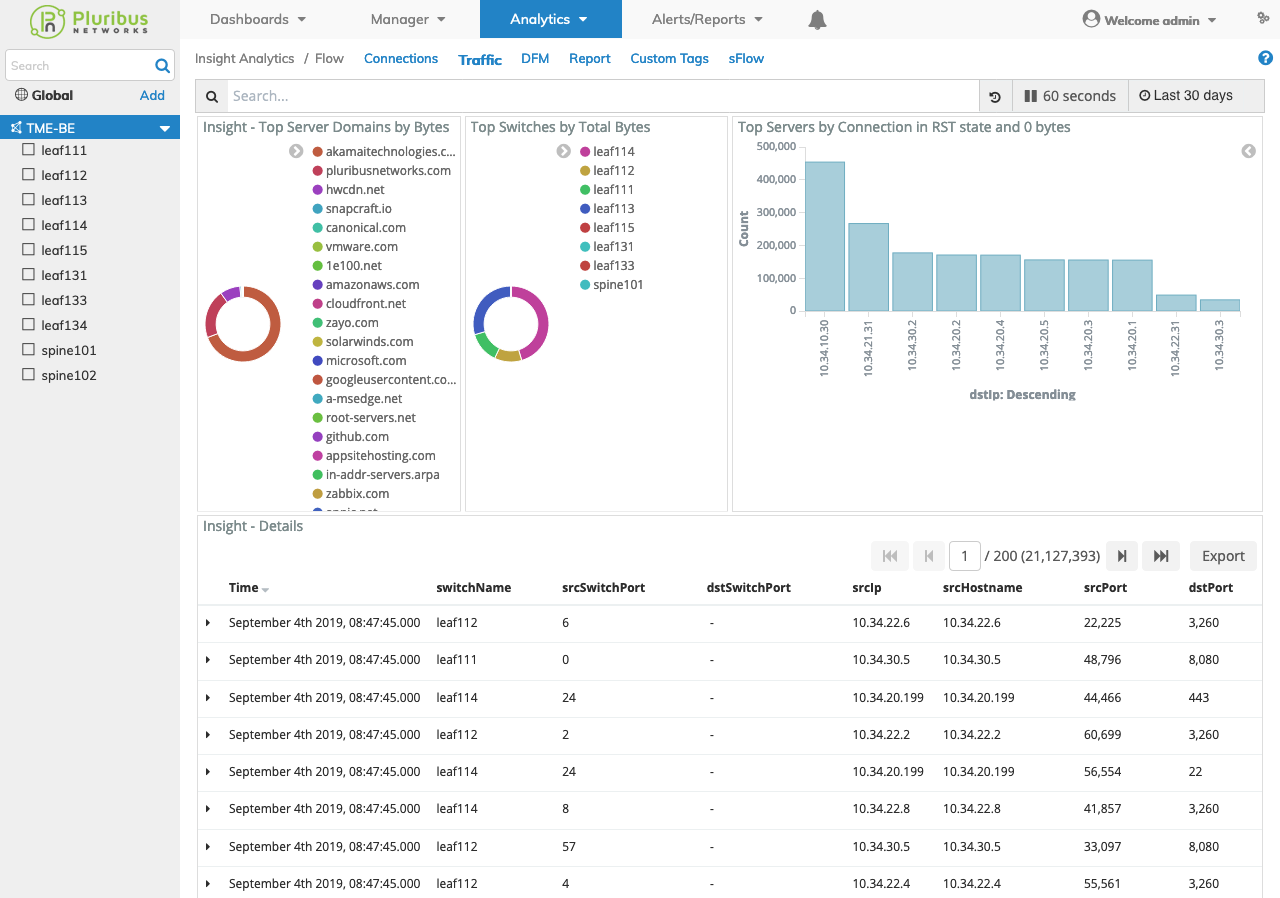
Insight Analytics Flow Traffic Details Lower Dashboard
Selecting a Switch within the Fabric automatically updates the Insight Analytics Traffic dashboard with information from the selected switch.
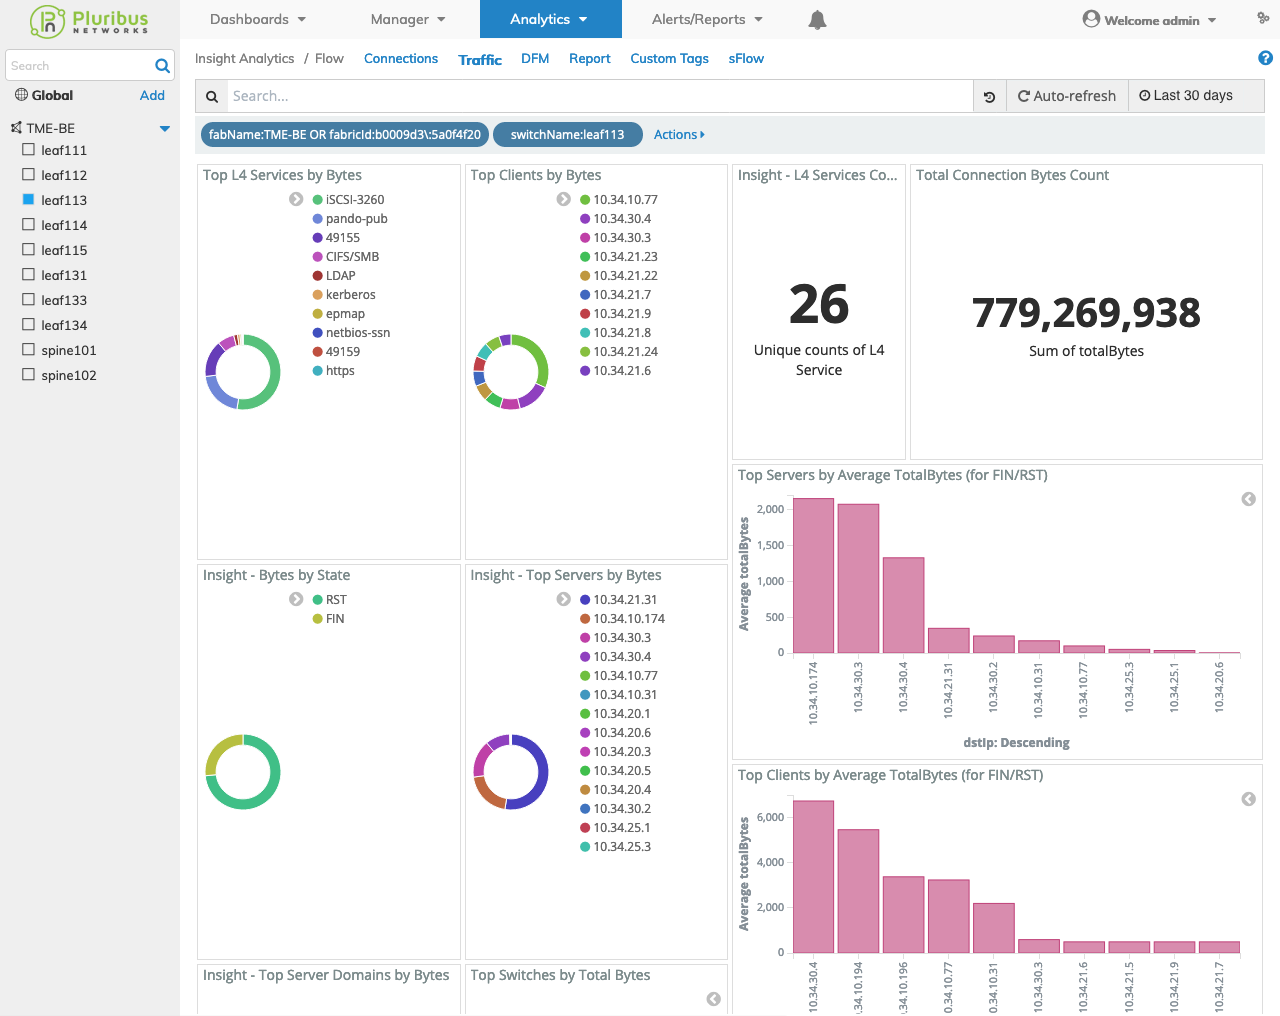
Insight Analytics Flow Traffic Details Lower Dashboard
Insight Analytics Flow General Features
Data drill-down, widget interaction, search and filtering functions work in a similar manner as described under the Insight Analytics Flow General Features section.