
VMware - Connections
Insight Analytics VMware Connections
There are features and functions used in UNUM Manager and UNUM Analytics that are common throughout the user interface (UI). Please refer to the Common Functions section for more information on the use of these functions and features.
Selecting Analytics → Insight Analytics VMware → Connections displays the Connections dashboard. The Connections tab highlights.
Usage Note: Before any analytics are collected, add a Fabric and install and activate a valid license.
While in the Insight Analytics VMware dashboard you navigate through VMware functions including, Connections, Traffic, and DFM.
Insight Analytics VMware Connections
The VMware dashboard is designed to analyze the health of the VMware infrastructure in correlation with the network.
Overall, the VMware Connections tab displays the following information:
•Connections by VM/vm-kernel – shows the number of VM and vm-kernel connections over the selected time.
•VMware Infrastructure Connections – shows total number of connections across the VMware infrastructure.
•vm-kernel Services by Connections – shows connections by service enabled on the vm-kernel adapters over the selected time.
•VM only Connections – shows total number of only WM connections across the VMware infrastructure.
•IP Storage vm-kernel Connections – type of IP storage and number of connections over the selected time.
•Connections by vCenter – shows the number of connections by vCenter instances.
•Virtual SAN Services – shows the type of virtual SAN services in use.
•Total VMs by vCenter – shows the total number of VM instances by vCenter.
•Top VM L4 Services – shows the top VM layer 4 services running.
•Top vm-kernel Services by Connections – shows the top vm-kernel services by connection.
• Top VM Clients by Connections – shows the top VM clients by connection.
•Top VM servers by Connections – shows the top VM servers by connection.
•Top ESXi Servers by Connections – shows the top ESXi servers by connection.
•Top vm-kernel Clients by Connections – shows the top vm-kernel clients by connection.
•Top Standard Port Groups by Connections – shows the top standard port groups by connection.
•Top Distributed Port Groups by Connections – shows the top distributed port groups by connection.
•VMware – Details – displays granular information about each connection.
The upper VMware Connections dashboard widgets include:
•Connections by VM/vm-kernel – shows the number of VM and vm-kernel connections over the selected time.
•VMware Infrastructure Connections – shows total number of connections across the VMware infrastructure.
•vm-kernel Services by Connections – shows connections by service enabled on the vm-kernel adapters over the selected time.
•VM only Connections – shows total number of only WM connections across the VMware infrastructure.
•IP Storage vm-kernel Connections – type of IP storage and number of connections over the selected time.
•Connections by vCenter – shows the number of connections by vCenter instances.
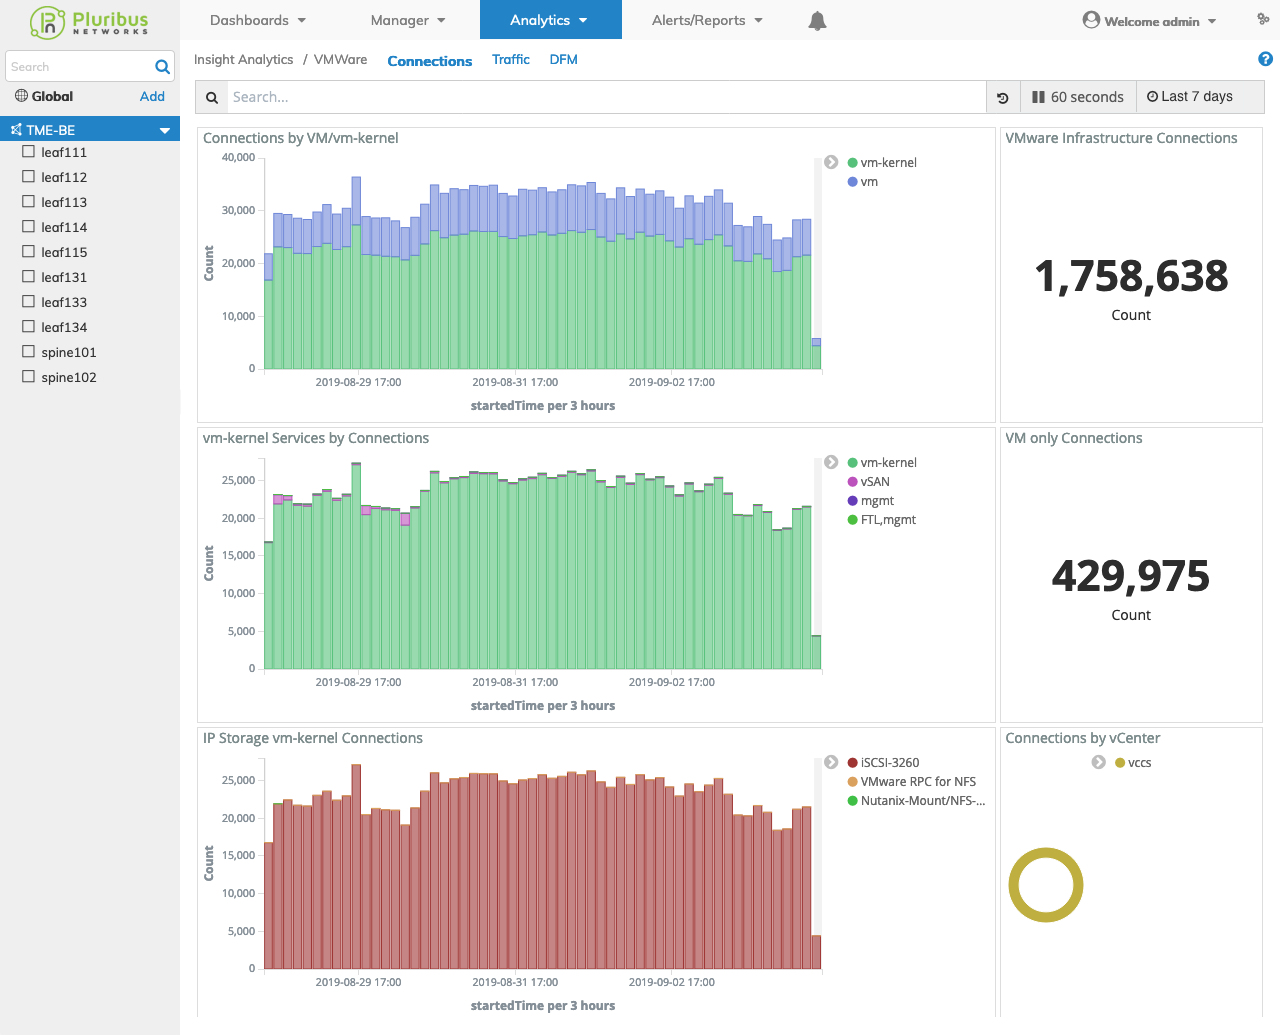
Insight Analytics VMware Connections Upper Dashboard
The middle VMware Connections dashboard widgets include:
•Virtual SAN Services – shows the type of virtual SAN services in use.
•Total VMs by vCenter – shows the total number of VM instances by vCenter.
•Top VM L4 Services – shows the top VM layer 4 services running.
•Top vm-kernel Services by Connections – shows the top vm-kernel services by connection.
• Top VM Clients by Connections – shows the top VM clients by connection.
•Top VM servers by Connections – shows the top VM servers by connection.
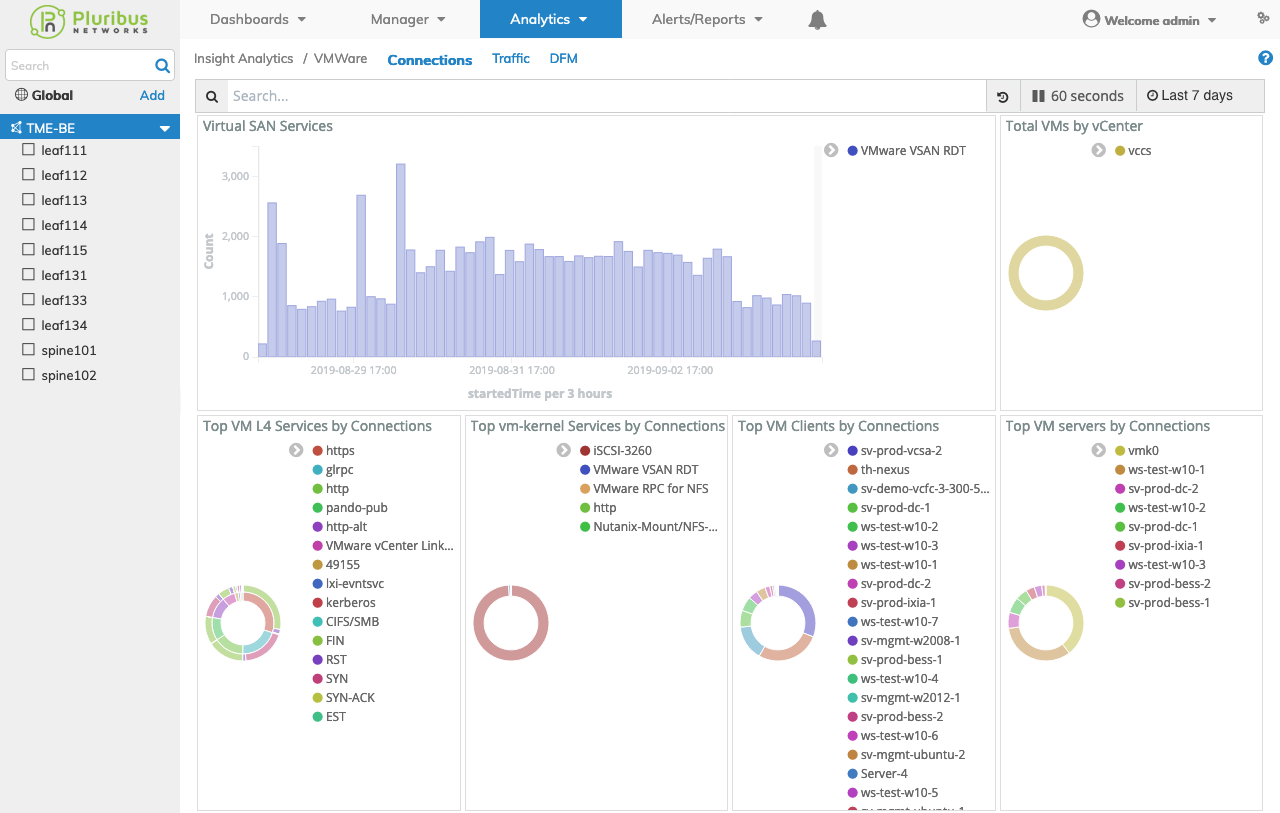
Insight Analytics VMware Connections Middle Dashboard
The lower VMware Connections dashboard widgets include:
•Top ESXi Servers by Connections – shows the top ESXi servers by connection.
•Top vm-kernel Clients by Connections – shows the top vm-kernel clients by connection.
•Top Standard Port Groups by Connections – shows the top standard port groups by connection.
•Top Distributed Port Groups by Connections – shows the top distributed port groups by connection.
•VMware – Details – displays granular information about each connection.
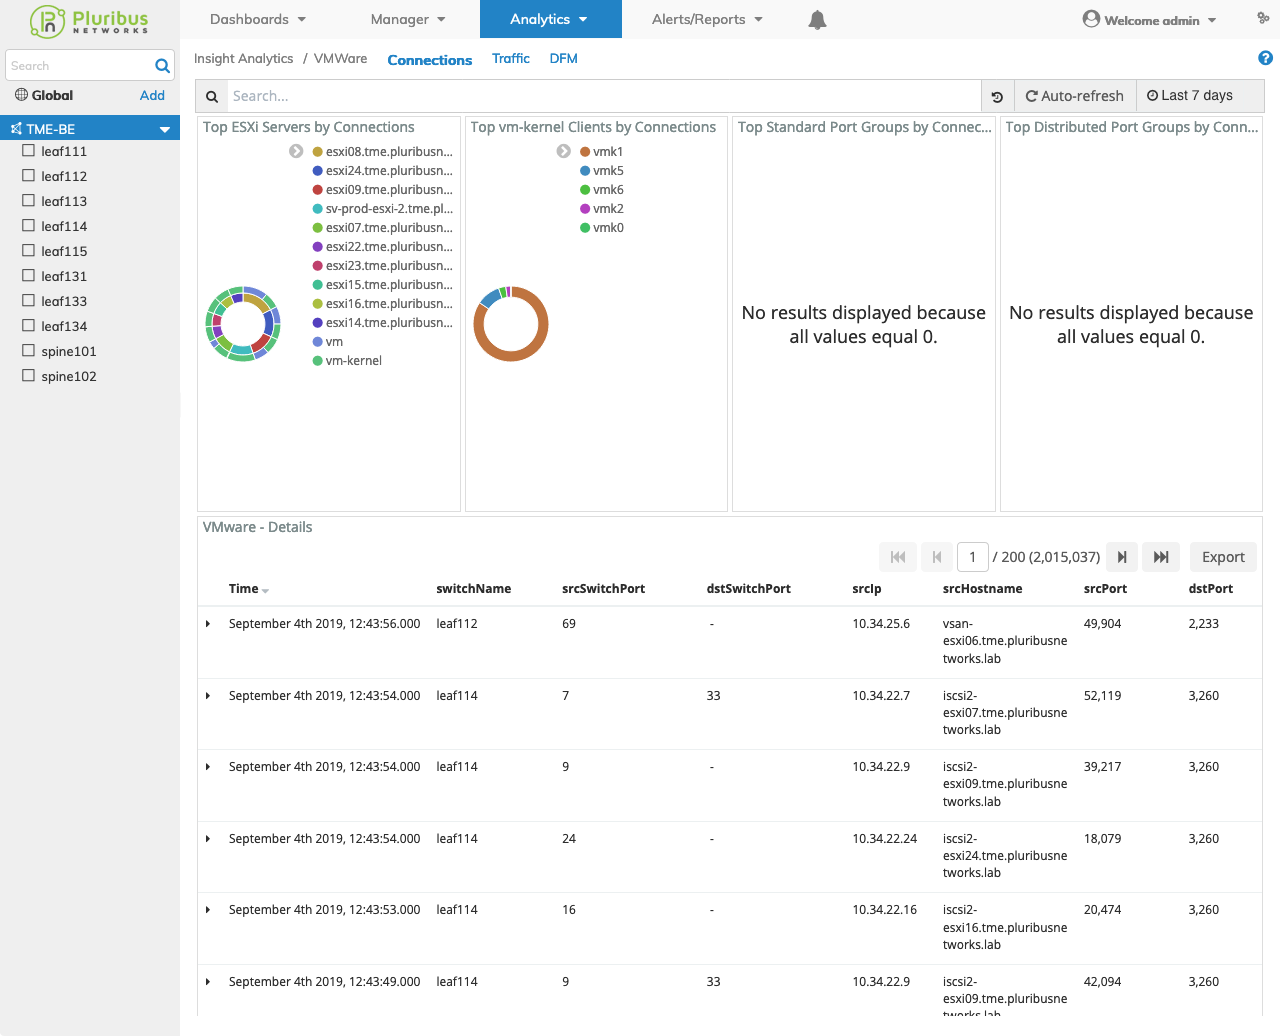
Insight Analytics VMware Connections Lower Dashboard
Selecting a Switch within the Fabric automatically updates the Insight Analytics VMware Connections dashboard with information from the selected switch.
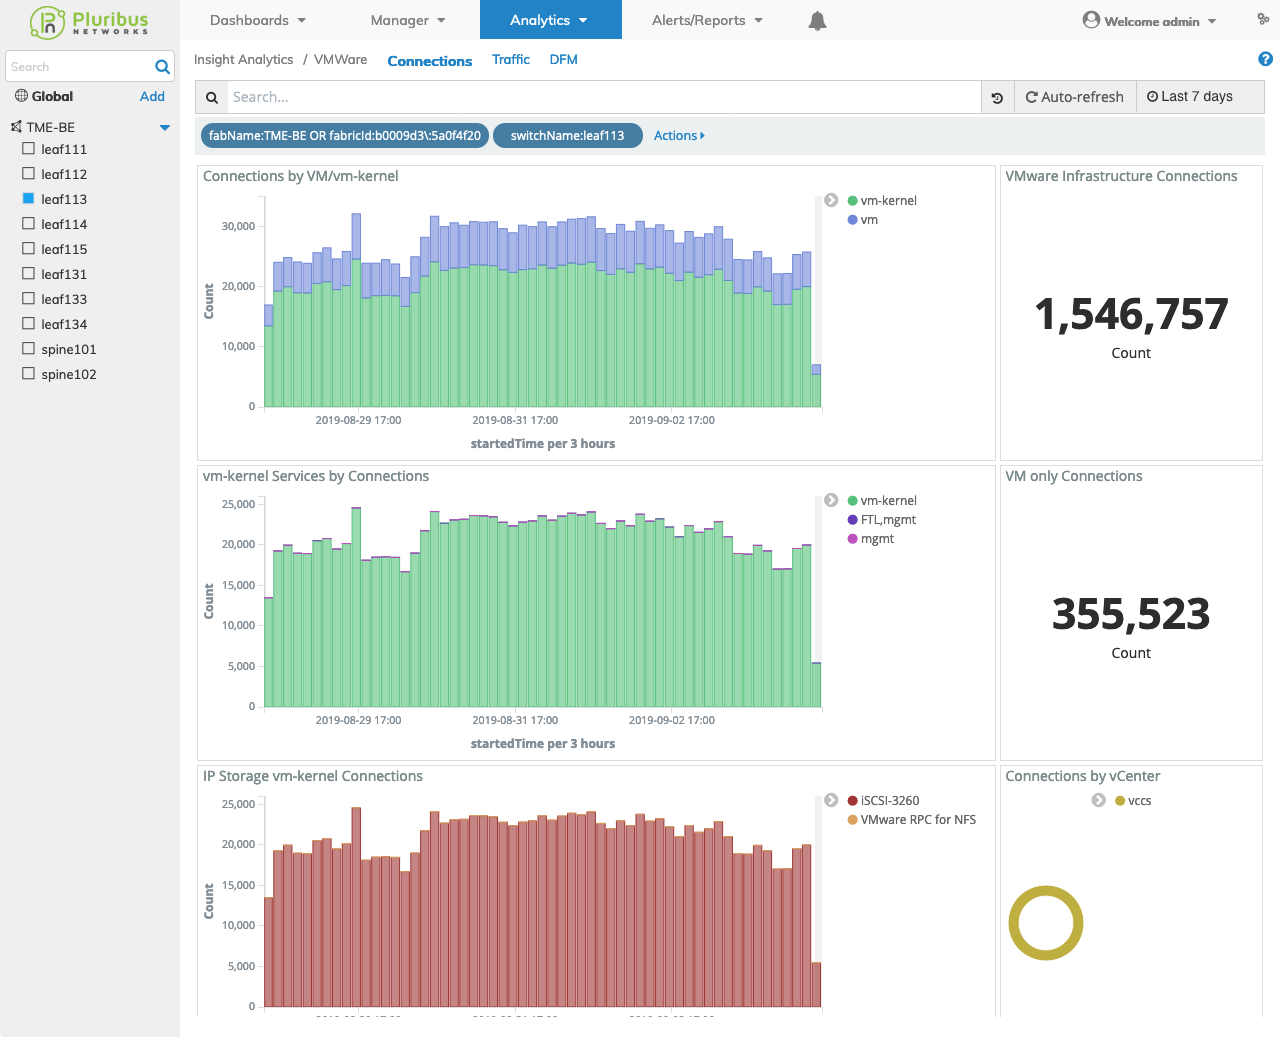
Insight Analytics VMware Connections Switch Dashboard
The VMware Connections module also supports global filters by clicking on any of the chart items.
You drill-down into the data by selecting any chart item in the dashboard and clicking on an area of interest.
Insight Analytics Flow General Features
Data drill-down, widget interaction, search and filtering functions work in a similar manner as described under the Insight Analytics Flow General Features section.