
Flow - Custom Tags
Insight Analytics Flow Custom Tags
Caution: Flow - Custom Tags is an Early Field Trial (EFT) feature. EFTs are intended for test environments and are not supported for use in production networks. You should consult your local partner or Arista Networks account team before using any EFT feature or to provide feedback.
There are features and functions used in Arista NetVisor UNUM and Insight Analytics that are common throughout the user interface (UI). Please refer to the Common Functions section for more information on the use of these functions and features.
Selecting Analytics → Insight Analytics Flow → Custom Tags displays the Custom Tags dashboard. The Custom Tags tab highlights.
Usage Note: Before any analytics are collected, add a Fabric and install and activate a valid license.
The NetVisor UNUM Insight Analytics Flow Tags module provides a convenient method of adding business and application context to flows using user edited custom defined tags.
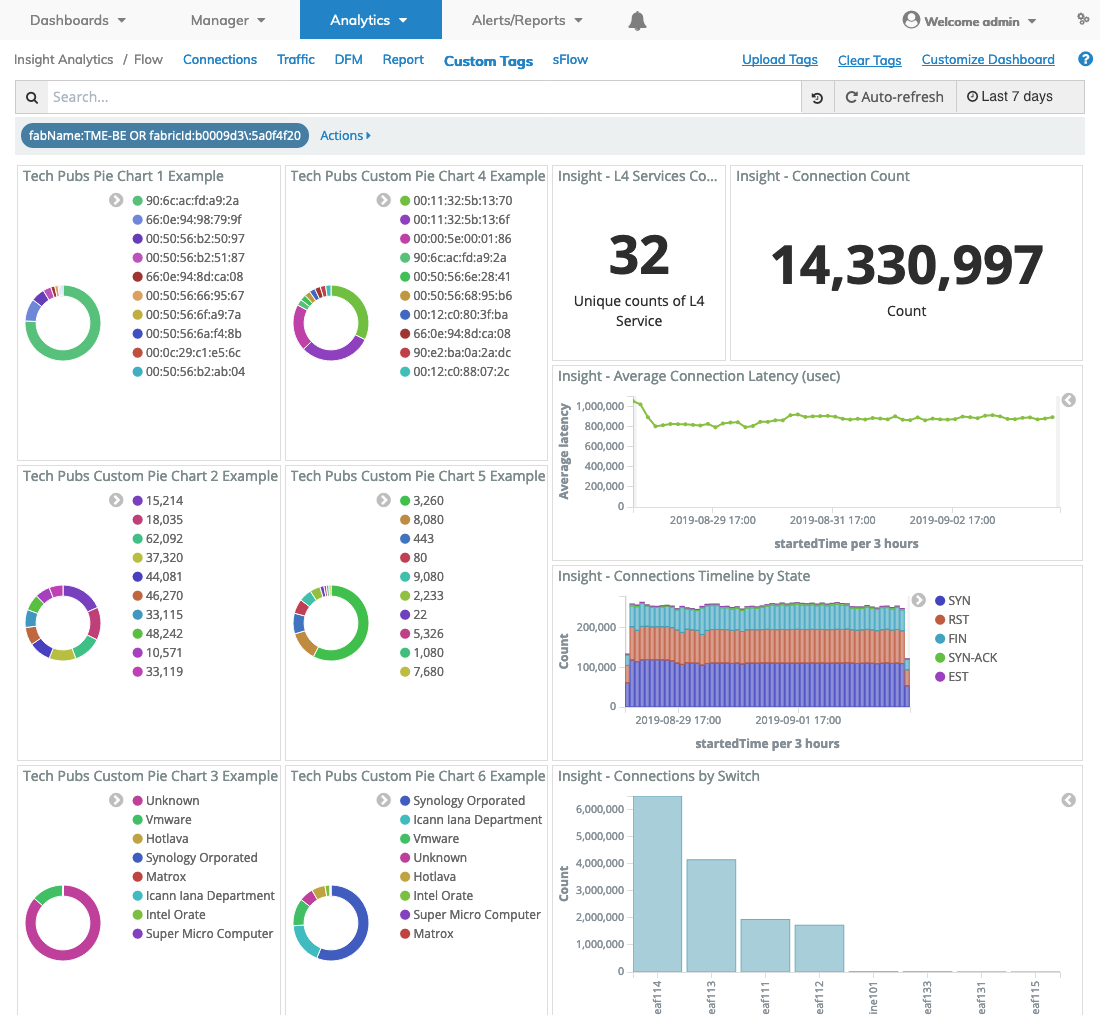
Clicking on custom Tags in the dashboard interface launches the Tags functionality and displays the following information:
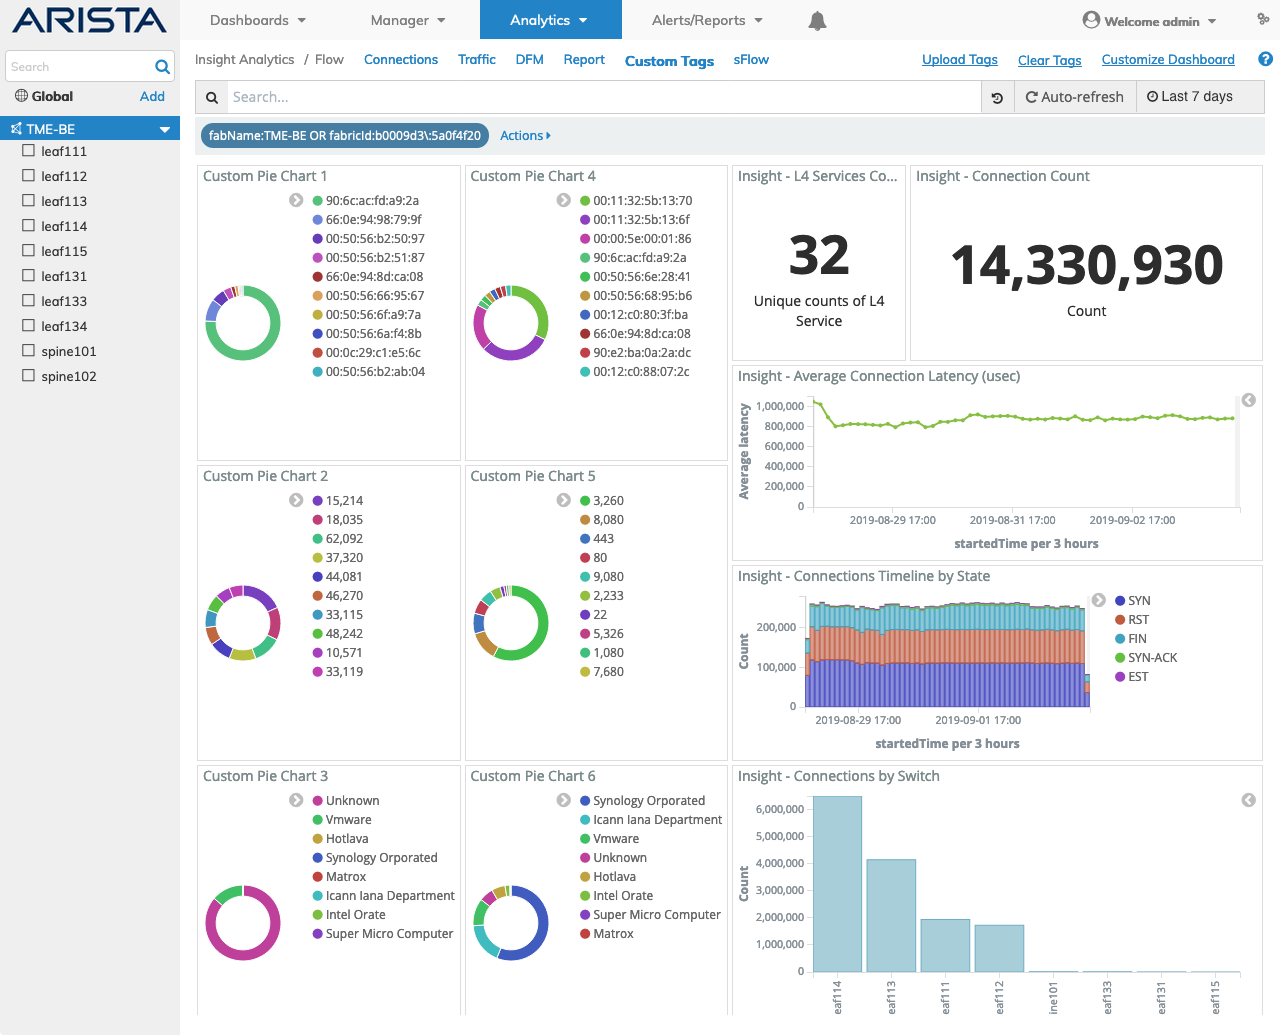
Insight Analytics Flow Custom Tags Dashboard
Selecting a Switch within the Fabric automatically updates the Insight Analytics Custom Tags dashboard with information from the selected switch.
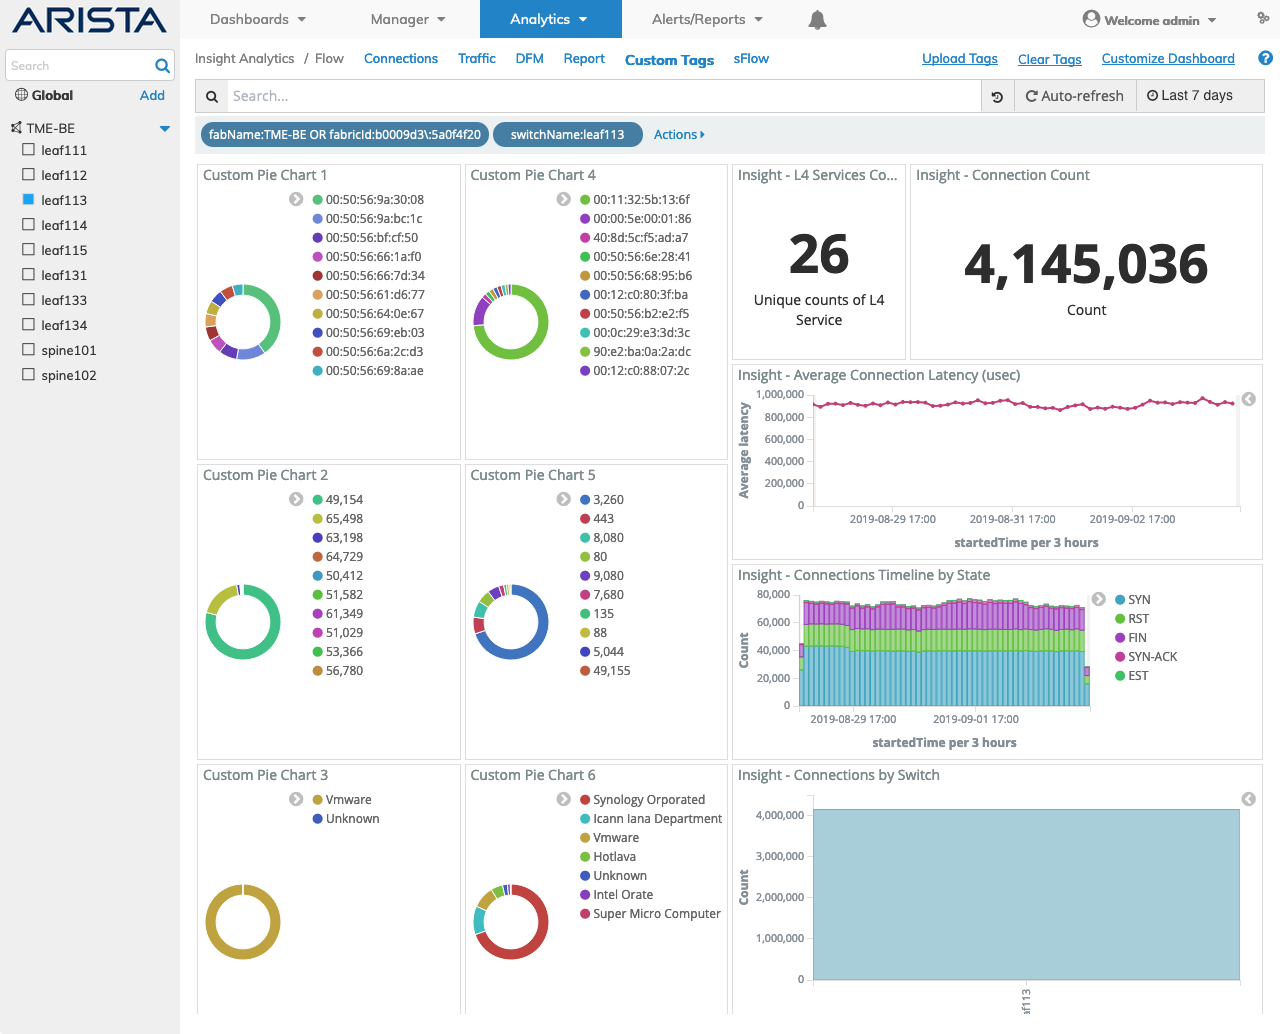
Insight Analytics Flow Custom Tags Switch Dashboard
The Custom Tags module also supports global filters by clicking on any of the chart items. You drill-down into the data by selecting any chart item in the dashboard and clicking on an area of interest.
Customizing Project Tags
Clicking on the option links: Upload Tags, Clear Tags and Customize Dashboard allows you to customize pie chart labels and upload tags from a spreadsheet and re-map fields.
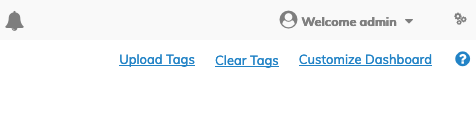
Insight Analytics Flow Custom Tags Customize Project Tags
The options are Upload, Clear Tags and Customize Dashboard.
Upload Tags
Clicking on the Upload Tags link displays an Upload Project Tags File window by which you select your own tagging file (see Creating Project Tags) in CSV or XML format to change the fields using the meta data you supply.
Browse for the location of the files or drag-and-drop the file containing the specified data and click Upload.
To exit the Upload Tags menu, click Close.
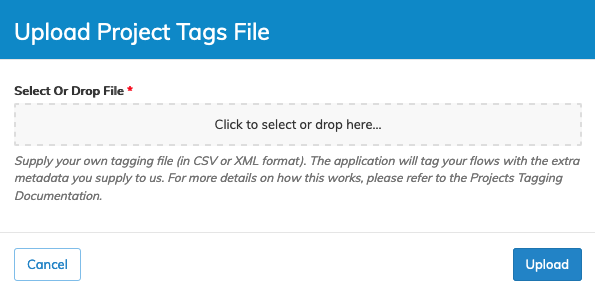
Insight Analytics Flow Upload Project Tags File Menu
Clear Tags
Clicking on the Clear Tags link immediately deletes all tag entries. You must re-enter ALL tag information following this action.
Custom Tags Customize Dashboard
Clicking on the Customize Dashboard link displays a customize window by which you edit the Title fields, select the data type for the Field and the type of data Aggregate applicable for the customized display.
Clicking Update! saves the new customization.
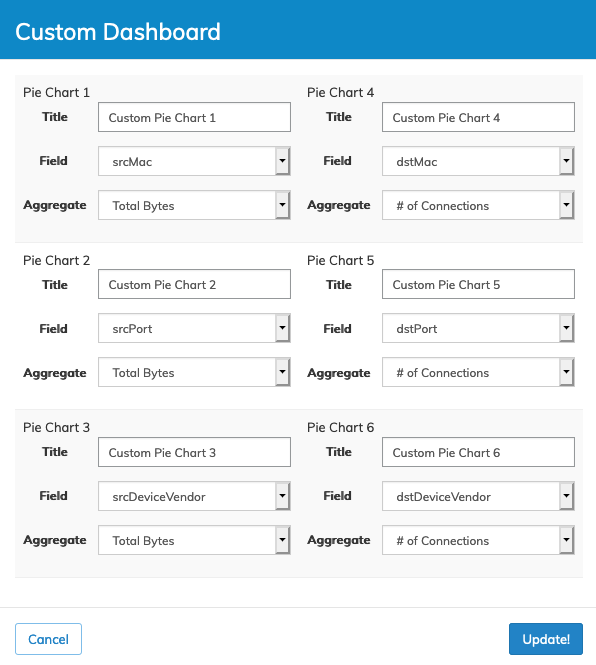
Insight Analytics Flow Customize Fields Menu
Creating Custom Tags
You create customized dashboards using Project Tags.
This feature allows you to view multiple projects using customized tags that you either select from a drop-down list or import as a *.csv file, a handy feature if you want to monitor specific sections of your network, such as a cluster storage configuration.
To create customized tags using NetVisor UNUM Insight Analytics Flow, click Options on the Project Tags page, and then Customize Dashboard.
You create up to six customized pie charts by entering titles for each pie chart and selecting the field to appear in the pie chart. Each pie chart aggregates data by Total Bytes or # of Connections.
Once you have created the pie charts, click Update!
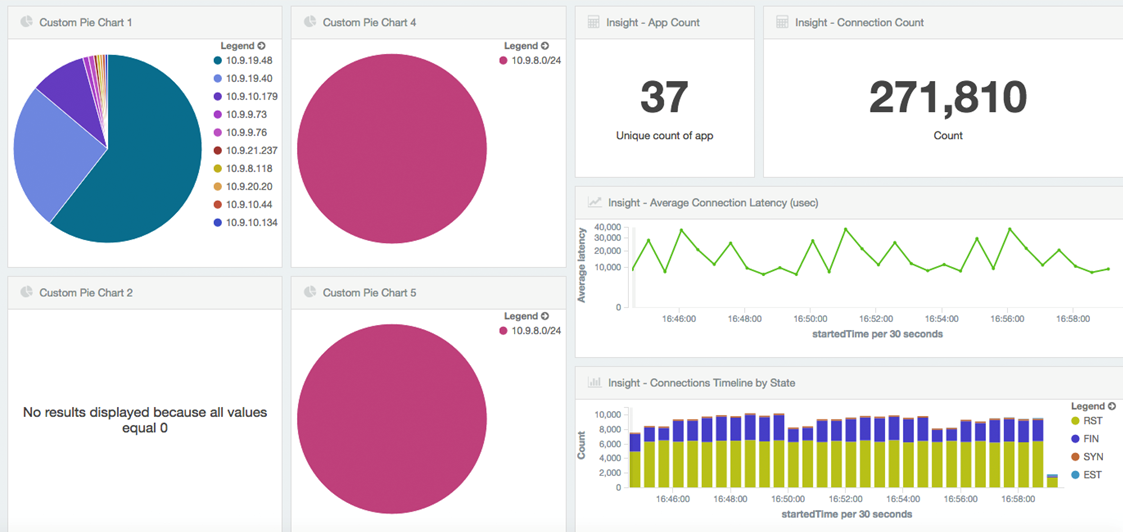
The dashboard updates with the new widget tags.
Insight Analytics Flow Customized Fields
Custom Excel Spreadsheet
To create a custom *.csv, use any spreadsheet application to create a new project file. Use the columns A through H to set up the fields, and each column must start with item_ and then the field name such as srcip, dstip, etc.
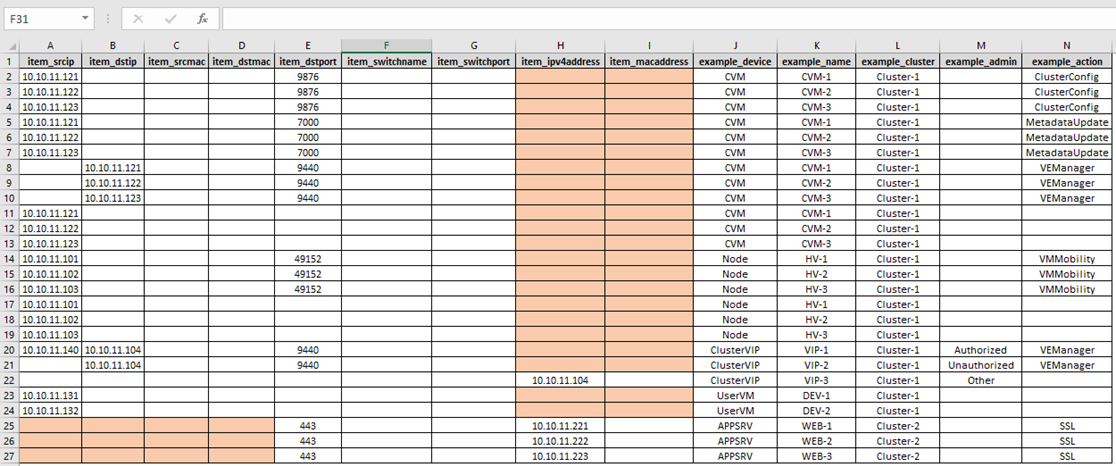
Insight Analytics Flow Custom Tags Template Spreadsheet
As the information is collected, each individual connection record is tagged at the time it is stored in NetVisor UNUM Insight Analytics Flow with system defined tags such as hostname and geo-coordinates. The figure above shows an Excel spreadsheet used to generate a CSV (Comma Separated Values) file.
The CSV file is then uploaded into NetVisor UNUM Insight Analytics Flow to start the custom tagging. Tagging (setting the attributes in column J and above) occurs when the connection record matches the conditions expressed in columns A to I (item_* columns).
NetVisor UNUM Insight Analytics Flow processes the conditions from top to bottom with the first match determining the tagging. Columns H and I match on the srcip OR dstip and on the srcmac OR the dstmac, and are mutually exclusive with the columns A/B or C/D.
You map a source IP address to all destination IP addresses or to a specific IP address. If a cell is left blank (highlighted in orange in the example spreadsheet), then it has the value of all as default. Once you have completed your spreadsheet and saved it as a *.csv file, you upload it to NetVisor UNUM Insight Analytics Flow by clicking Options, and then Upload. Locate your CSV file and upload it to NetVisor UNUM Insight Analytics Flow. You use the format <ip>/<netmask> for these fields as well.
In the example spreadsheet above, line 2 has the highest priority and line 27 the lowest priority when collecting data. A security allowlist is represented on lines 20 – 22 and lines 23 – 27 show how specific application server information is collected.
Wildcard Subnet for IP Address Fields
This feature adds functionality to custom tagging.
With the current custom tagging implementation, exact matches are performed for source IP addresses and destination IP addresses.
You specify an IP Address range in the format <ip>/<netmask>.
An example tag entry may have this format:
item_srcip
item_dstip
item_srcmac
item_dstmac
item_dstport
item_vlanid
item_ipv4address
item_macaddress
Owner
Device
Group
Initiatives
Function
Security_List
and return the following information:
10.9.34.159
98:e0:d9:8b:60:4f
,,,,,,
User
MacBookAir
Product_Mgmt
Big Bets
Work Laptop
Not_Authorized
10.34.15.0/24
,,,,,,
Test User
iPhone
Product_Mgmt
Big Bets
Mobile Phone
Not_Authorized
In the tag file, there are samples with both a single IP Address, first entry, and a range of IP Addresses, second entry. When you upload a tag file with entries in <ip>/<netmask> format, during the flow tagging, a check is performed to see if the specified IP address from the flow is part of the subnet range, rather than performing an exact match. In the example, any flow with a destination IP address within the range 10.34.15.1 - 10.34.15.254 is considered a match and tagged with the custom tagging attributes.
Specify the IP address in subnet format for the fields item_srcip, item_dstip and item_ipv4address.
Insight Analytics Flow Custom Tags using Subnet Mask Example
Insight Analytics Flow General Features
Data drill-down, widget interaction, search and filtering functions work in a similar manner as described under the Insight Analytics Flow General Features section.