
Connectivity Stats - Fabric Connectivity Dashboard
Connectivity Stats - Fabric Connectivity Dashboard
Caution: Connectivity Stats - Fabric Connectivity Dashboard is an Early Field Trial (EFT) feature. EFTs are intended for test environments and are not supported for use in production networks. You should consult your local partner or Arista Networks account team before using any EFT feature or to provide feedback.
There are features and functions used in Arista NetVisor UNUM and Insight Analytics that are common throughout the user interface (UI). Please refer to the Common Functions section for more information on the use of these functions and features.
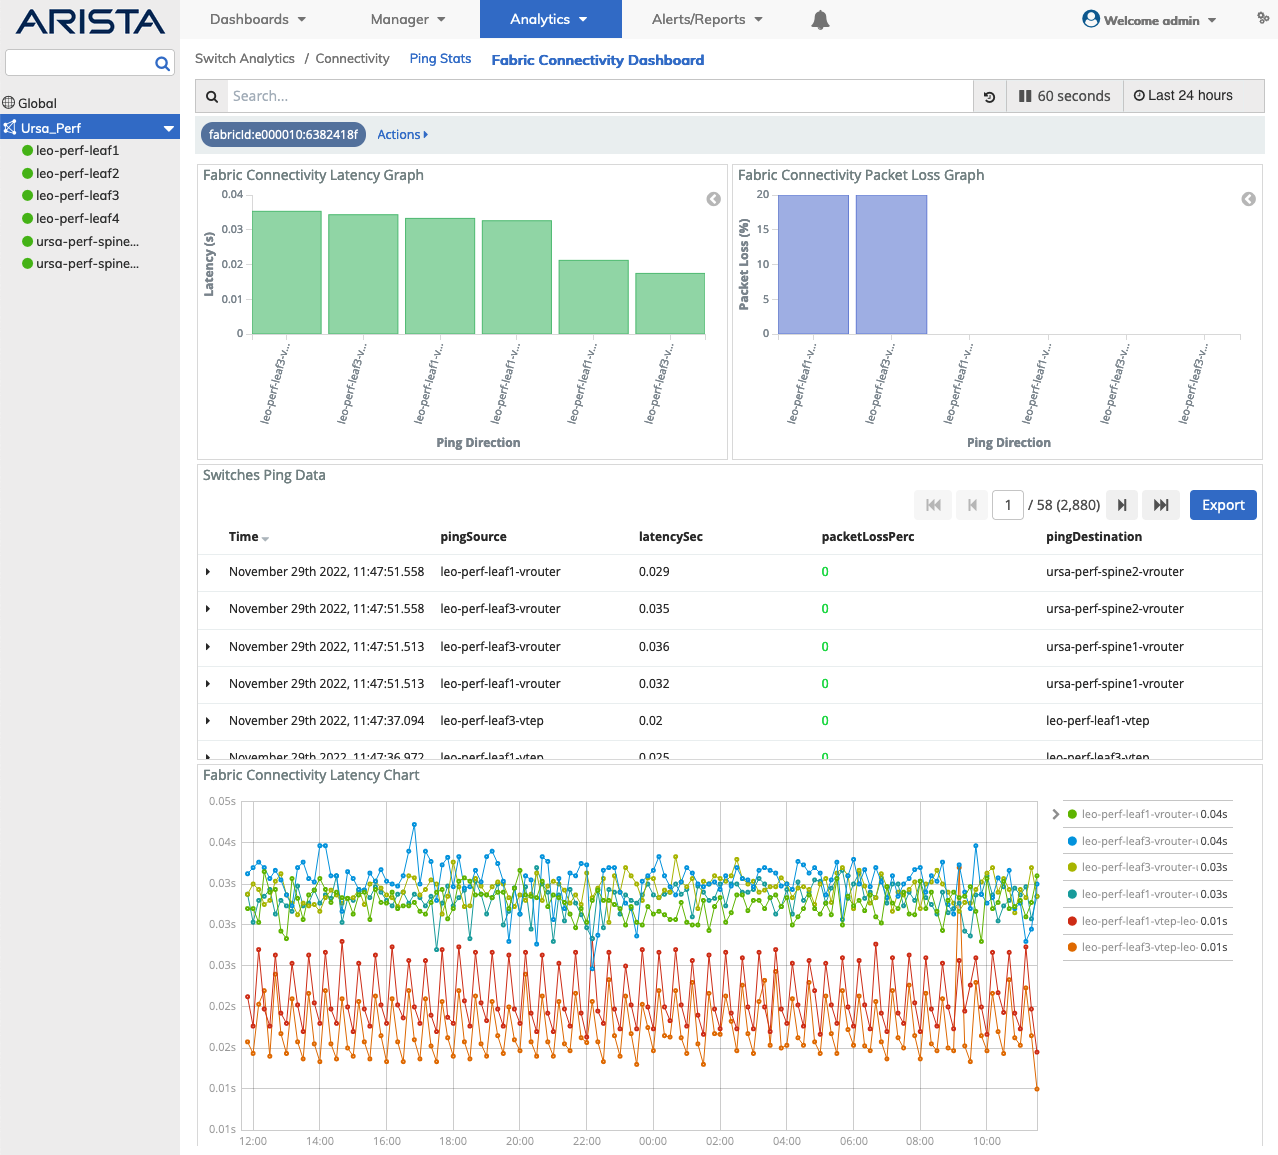
Selecting Analytics → Switch Analytics → Connectivity → Fabric Connectivity Dashboard displays the Fabric Connectivity Dashboard dashboard. The Fabric Connectivity Dashboard tab highlights.
The data contained in the Fabric Connectivity Dashboard derives from the Mesh Ping connectivity function. NetVisor UNUM runs a scheduled job performing a mesh vrouter-ping from one VTEP to all other VTEPs in the Fabric. The Fabric Connectivity Dashboard displays the latency and packet loss data as live, historical, graphical, and tabular data. VTEP pings are performed between leafs as well as leaf to spine.
Configuring the VTEP scheduler is done using the ./UNUM_setup.sh script by selecting Advanced Settings. Configuration settings include:
•Enable | Disable VTEP Mesh Ping – Enable or Disable. The default state is disabled.
•VTEP Mesh Ping Interval – In minutes from 3 to 60 minutes. The default is 5.
•VTEP Ping Packet Count – From 5 to 20. The default is 5.
Note: Disabled by default, enable the VTEP Mesh Ping in Advanced Settings to use the feature. Enabling or disabling the VTEP Mesh Ping feature or changing its associated values does not require a NetVisor UNUM restart.
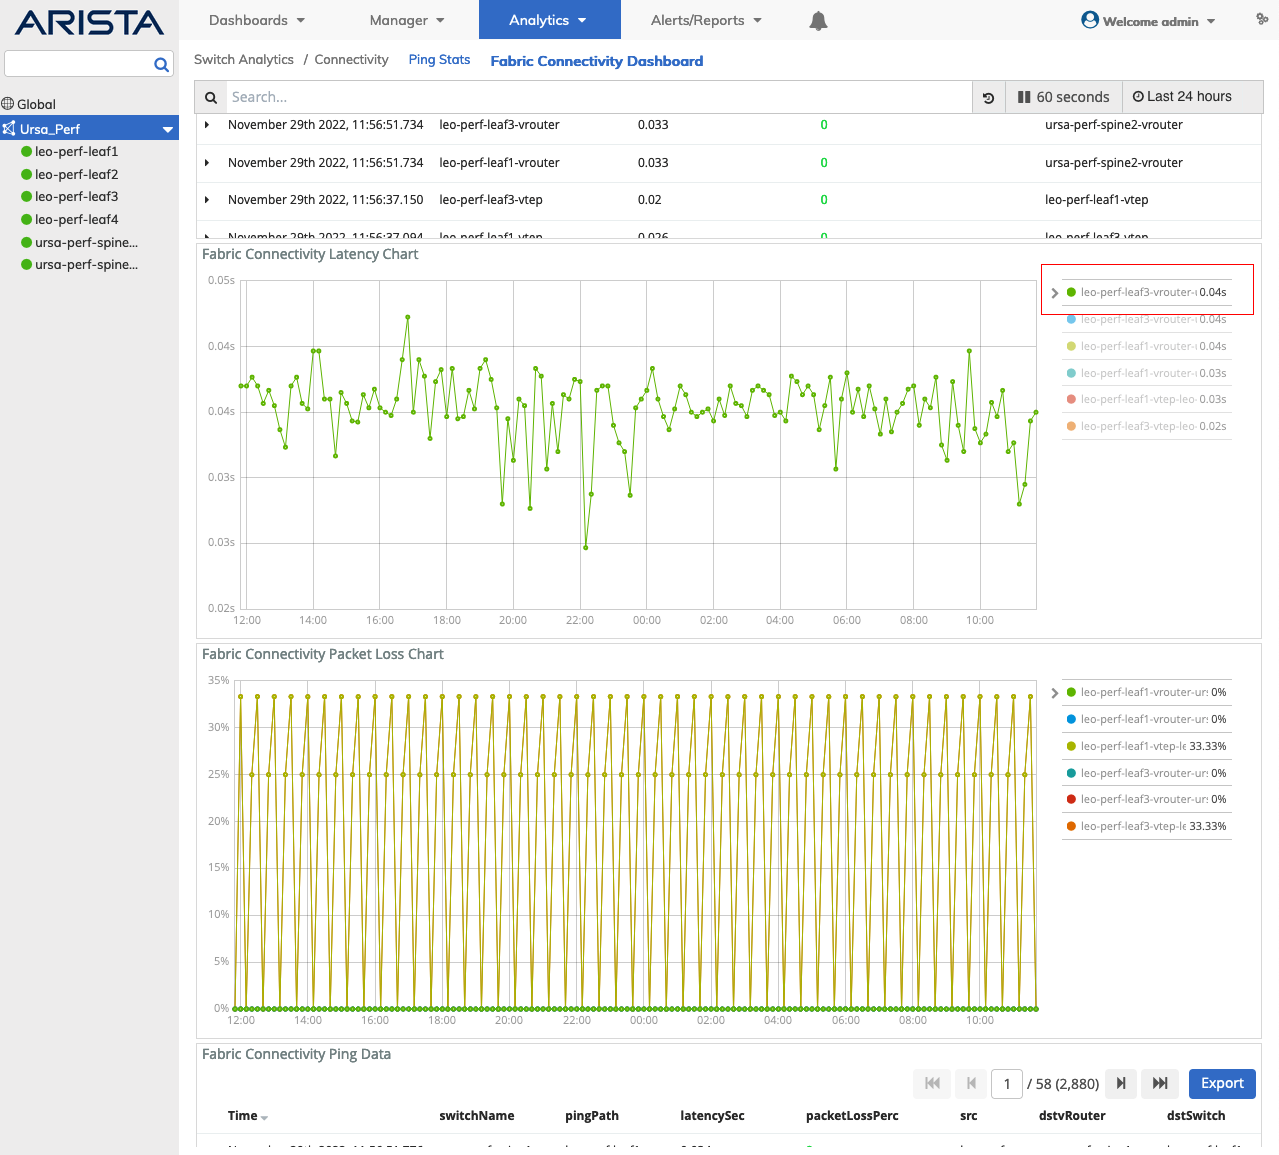
Select the applicable Fabric from the left-hand navigation bar and the dashboard updates showing all Fabric Connectivity Dashboard entries from all switches within the Fabric.
Fabric Connectivity Dashboard dashboard widgets include:
•Fabric Connectivity Latency Graph – Latency in seconds and Ping Direction.
•Fabric Connectivity Packet Loss Graph – Packet Loss in percentage and Ping Direction.
•Switches Ping Data – Tabular and JSON data of ping results by switch.
•Fabric Connectivity Latency Chart – Time series graph of Fabric latency by node in the Fabric. Individual switch selection updates the chart.
•Fabric Connectivity Packet Loss Chart – Time series graph of Fabric Connectivity Packet Loss by percentage by node in the Fabric. Individual switch selection updates the chart.
•Fabric Connectivity Ping Data – Tabular and JSON data of Fabric Connectivity of ping results including ping path.
Switch Analytics - Fabric Connectivity Dashboard
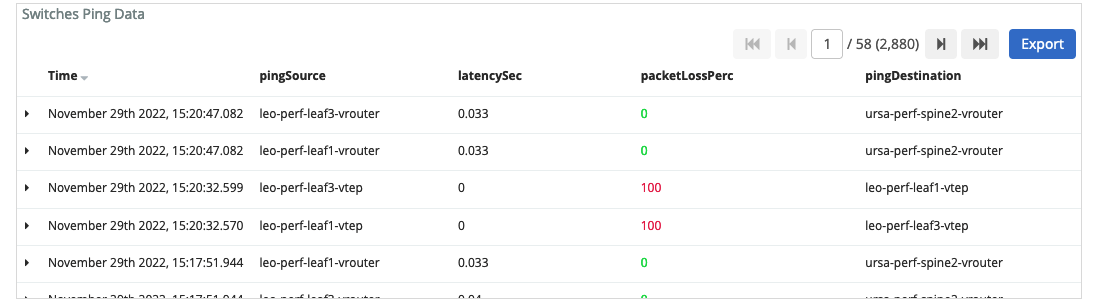
Packet Loss Color Coding
The Switches Ping Data and Fabric Connectivity Ping Data packetLossPerc columns displays color-coded data in the following manner:
•0 - 9% = Green (green)
•10 - 59% = Orange (orange)
•60 - 100% = Red (red)
Switch Analytics - Fabric Connectivity Dashboard Color Coding
Scroll through the dashboard to view the Fabric Connectivity Latency and Packet Loss Charts.
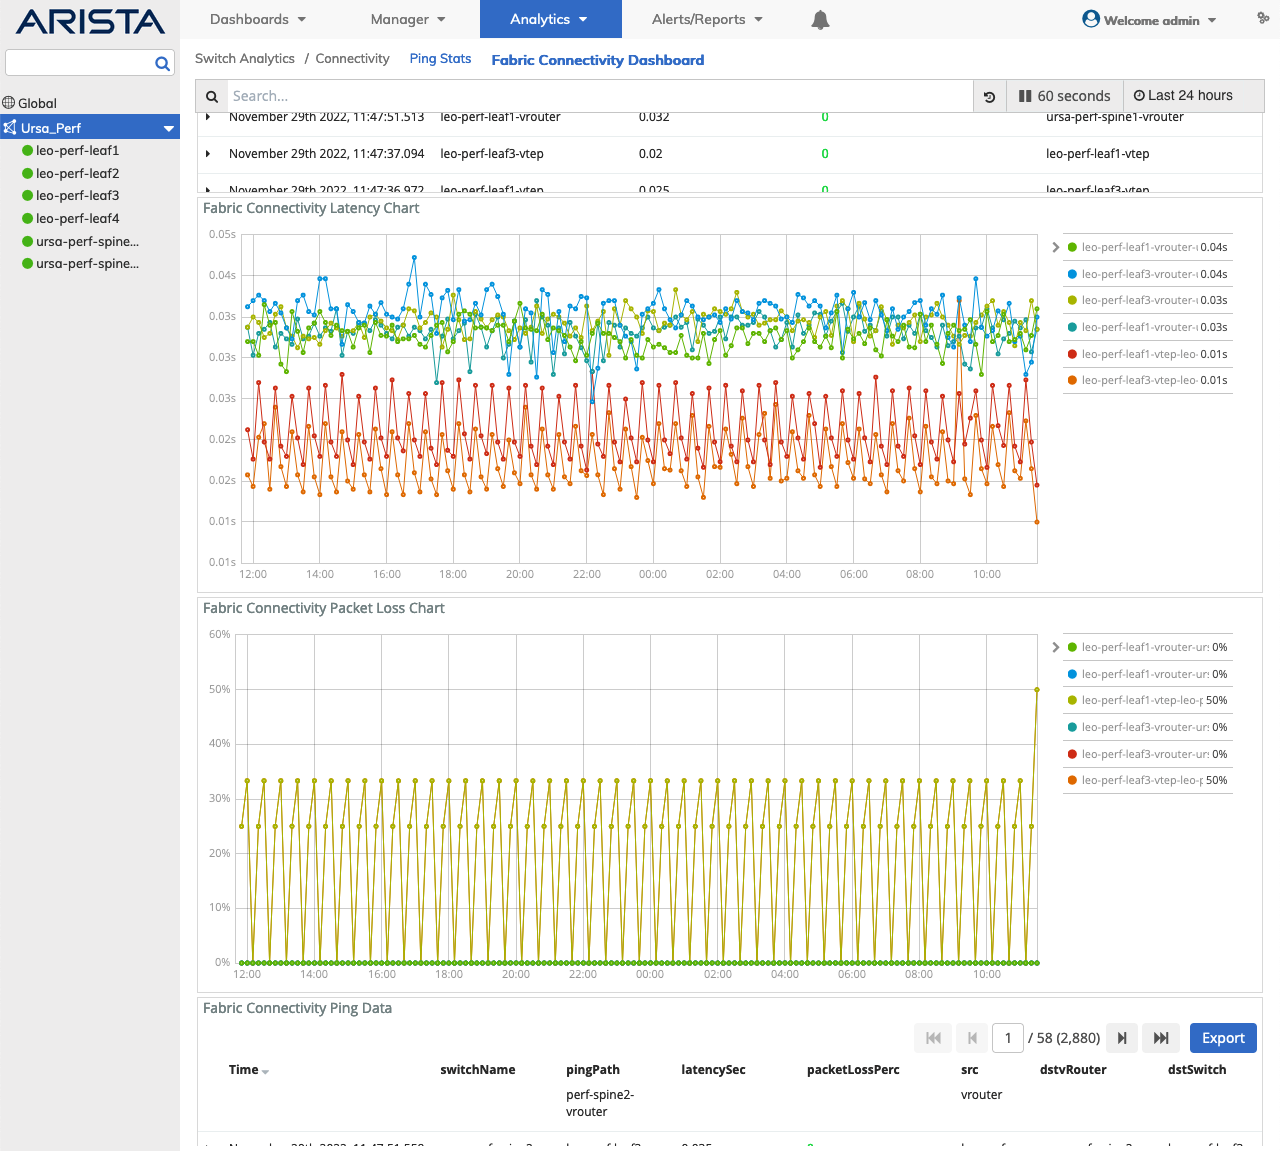
Switch Analytics - Fabric Connectivity Latency and Packet Loss Charts
Click on a widget entry to drilldown into the data or select a switch from the LHN.
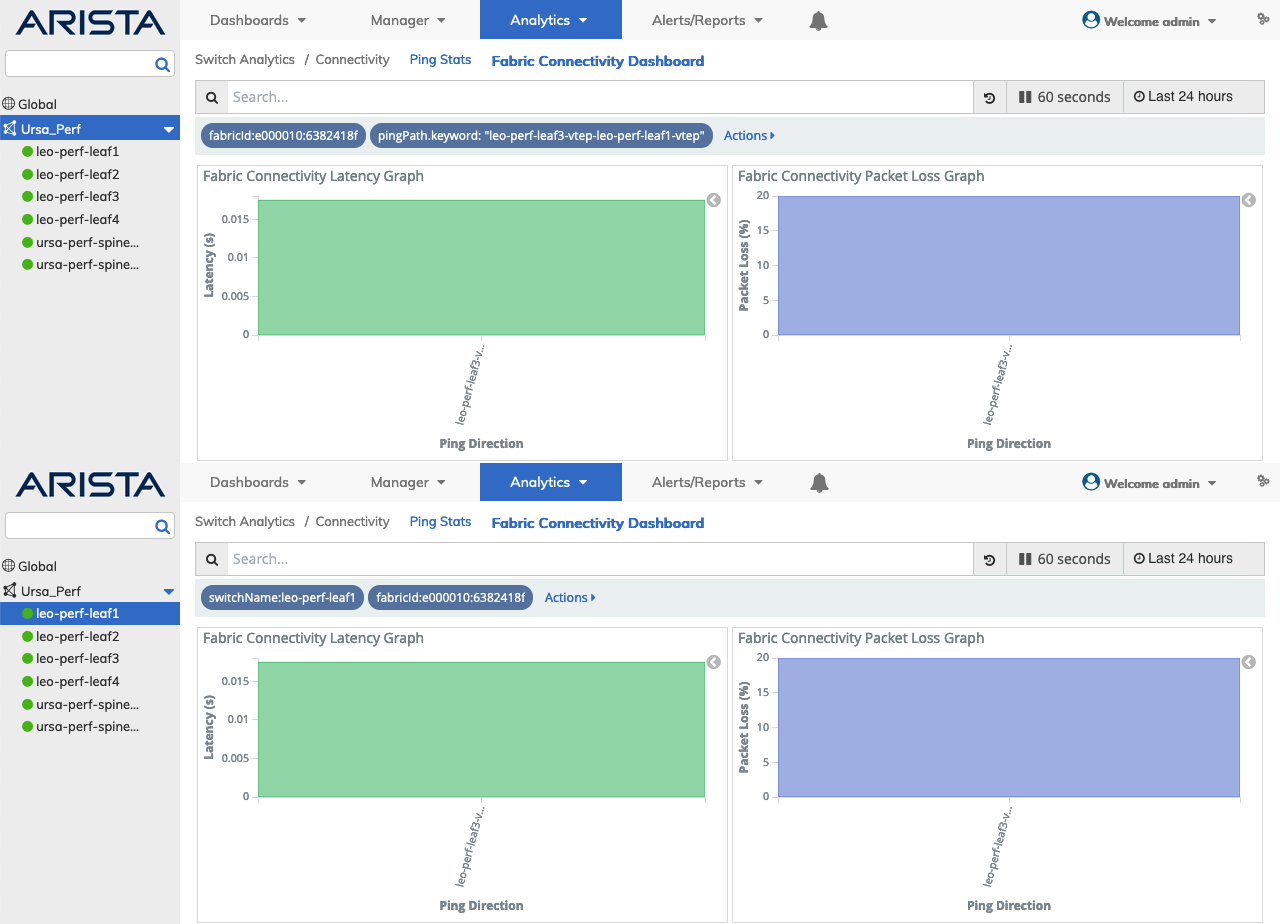
Switch Analytics - Fabric Connectivity Latency and Packet Loss Drilldown by Switch
Toggle on a switch entry in the Fabric Connectivity Latency or Packet Loss Graph or to drilldown into the data. Toggle the entry again to display information from all nodes.
Switch Analytics - Fabric Connectivity Latency and Packet Loss Chart Drilldown by Switch
Fabric Connectivity Dashboard Search
A Search function provides a useful method of searching for ping stats related information using an auto-populate feature based on previous searches.
You begin by entering a switch or vRouter name, or by clicking on an area of a pie chart or histogram.
The Latency and Packet Loss related information displayed in the graphical interface is updated with data from the search criteria and the filter information highlights in the filter bar.
Multiple searches populate the filter bar.
Switches Ping Data & Fabric Connectivity Ping Data Filtering
Rolling over a column in the Switches Ping Data or Fabric Connectivity Ping Data - Details section reveals a ![]() icon used to Add or Remove filters from the search criteria.
icon used to Add or Remove filters from the search criteria.
Clicking on the ![]() icon in the Switches Ping Data or Fabric Connectivity Ping Data - Details section reveals Tabular and JSON data.
icon in the Switches Ping Data or Fabric Connectivity Ping Data - Details section reveals Tabular and JSON data.
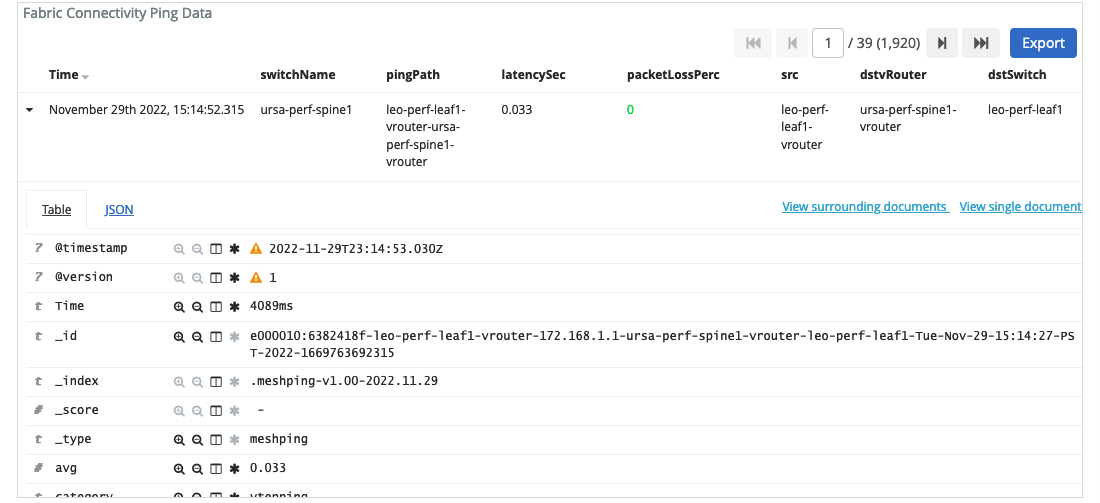
Switch Analytics - Fabric Connectivity Ping Data Details