
Details Pane
Topology Details Pane
There are features and functions used in Arista NetVisor UNUM and Insight Analytics that are common throughout the user interface (UI). Please refer to the Common Functions section for more information on the use of these functions and features.
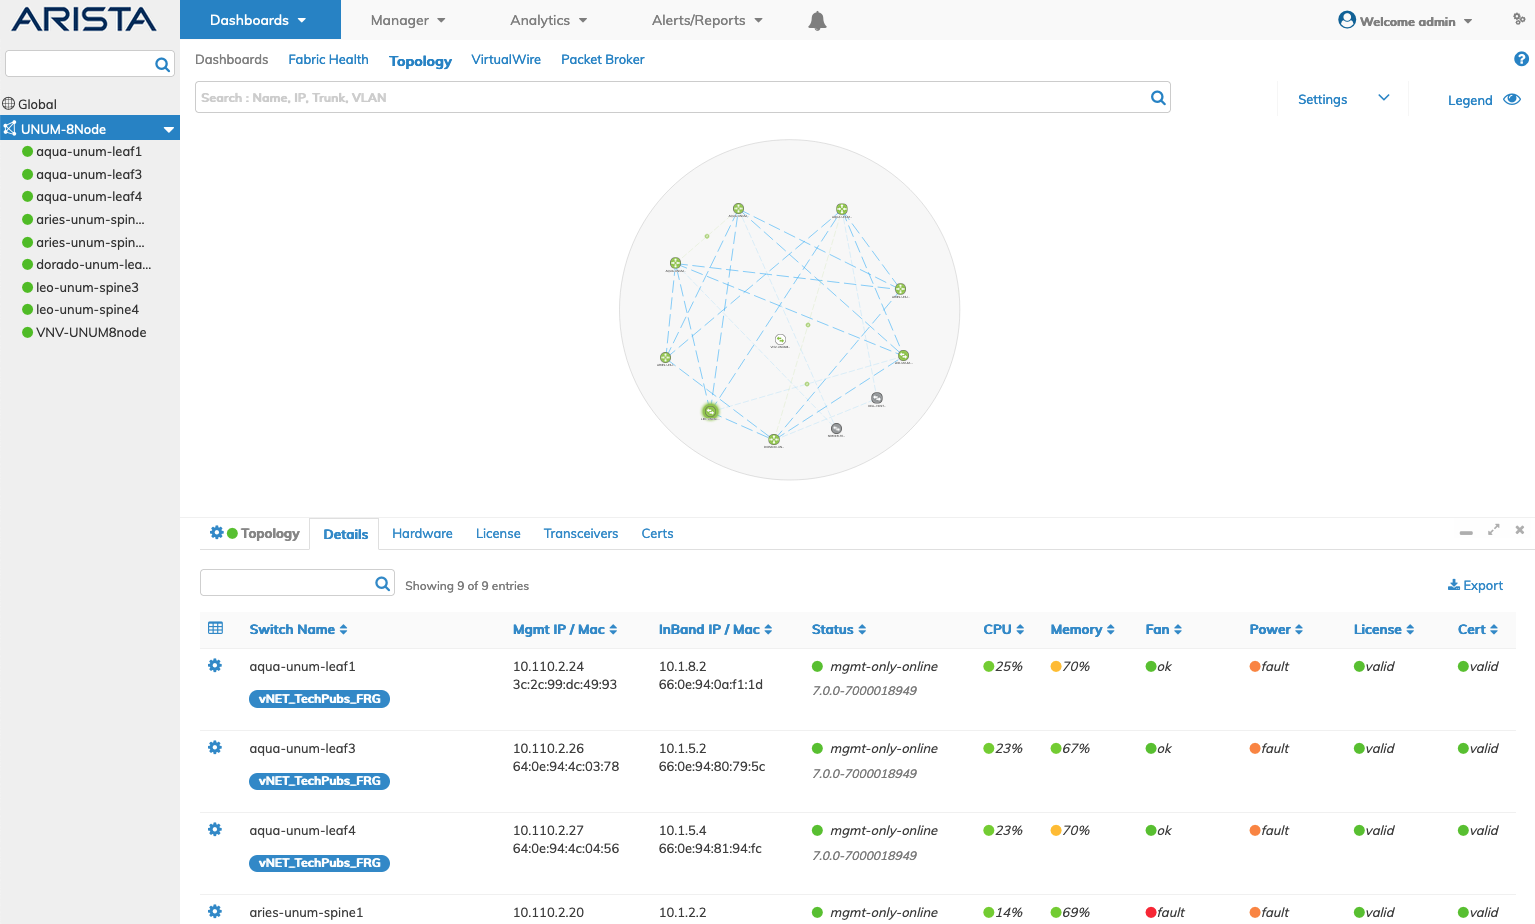
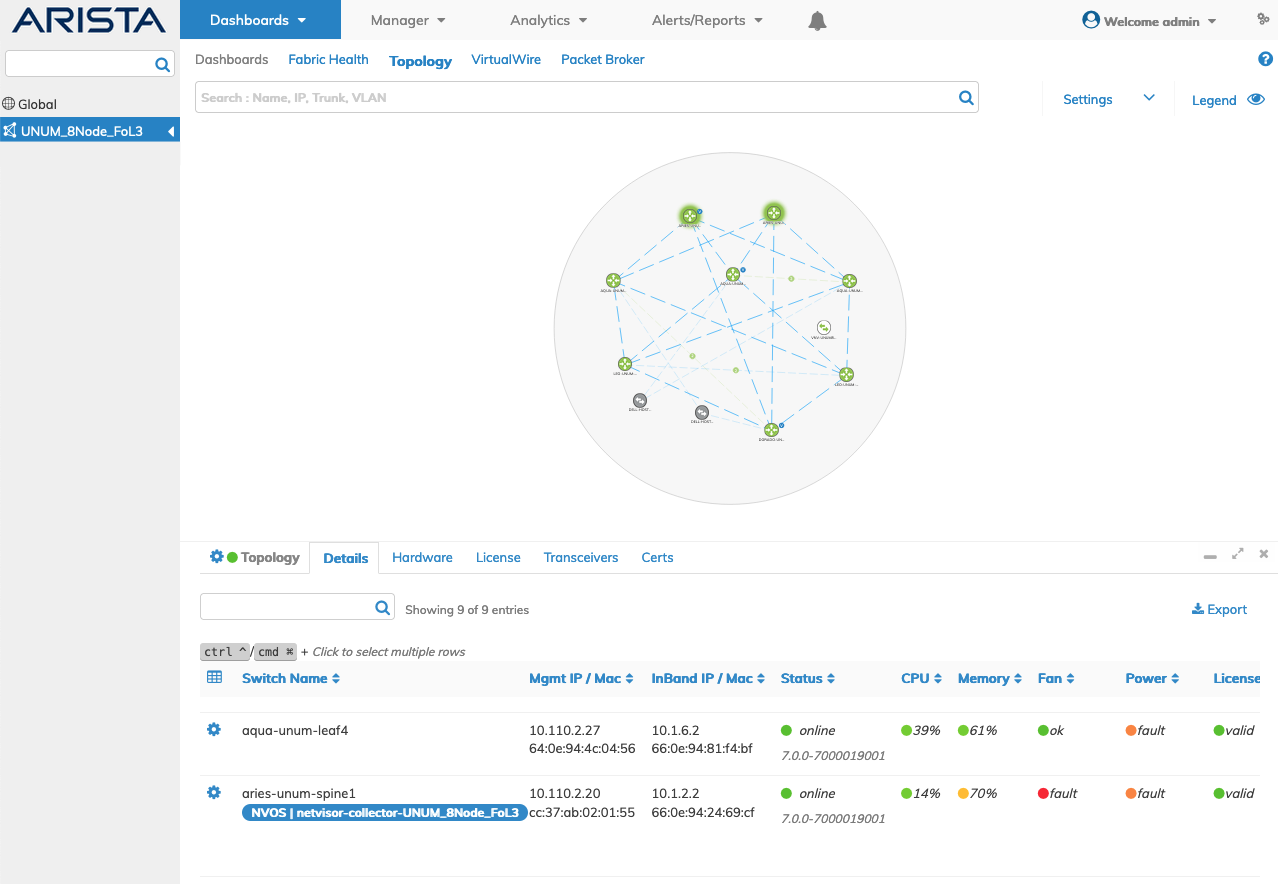
The bottom of the Topology Dashboard contains the Topology Details Pane, which provides extensive information about the Fabric and the devices.
The tabs include:
Topology Tab
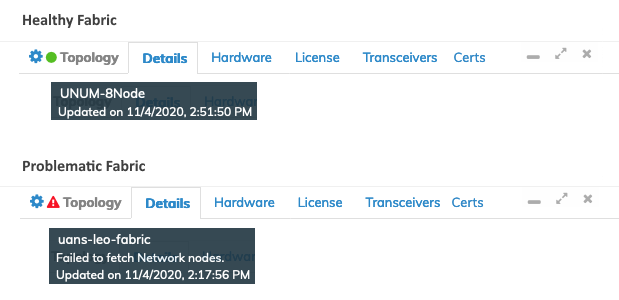
The Topology tab displays the current status.
A Green visual indicator ![]() shows the Fabric is healthy.
shows the Fabric is healthy.
The Alert ![]() visual indicator shows a switch software mismatch within the Fabric or a lost connection to a seed switch.
visual indicator shows a switch software mismatch within the Fabric or a lost connection to a seed switch.
Rolling over a visual indicator displays a pop-up message providing details about the status or error condition.
Topology Details Status Condition Examples
In addition to the visual indicators described above, the following table describes all Status indicators in the Details Pane.
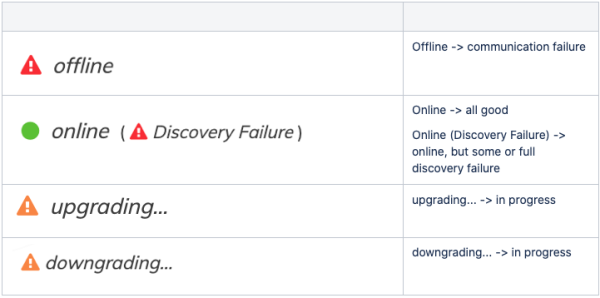
Topology Details Status Conditions
Trigger Fabric Discovery
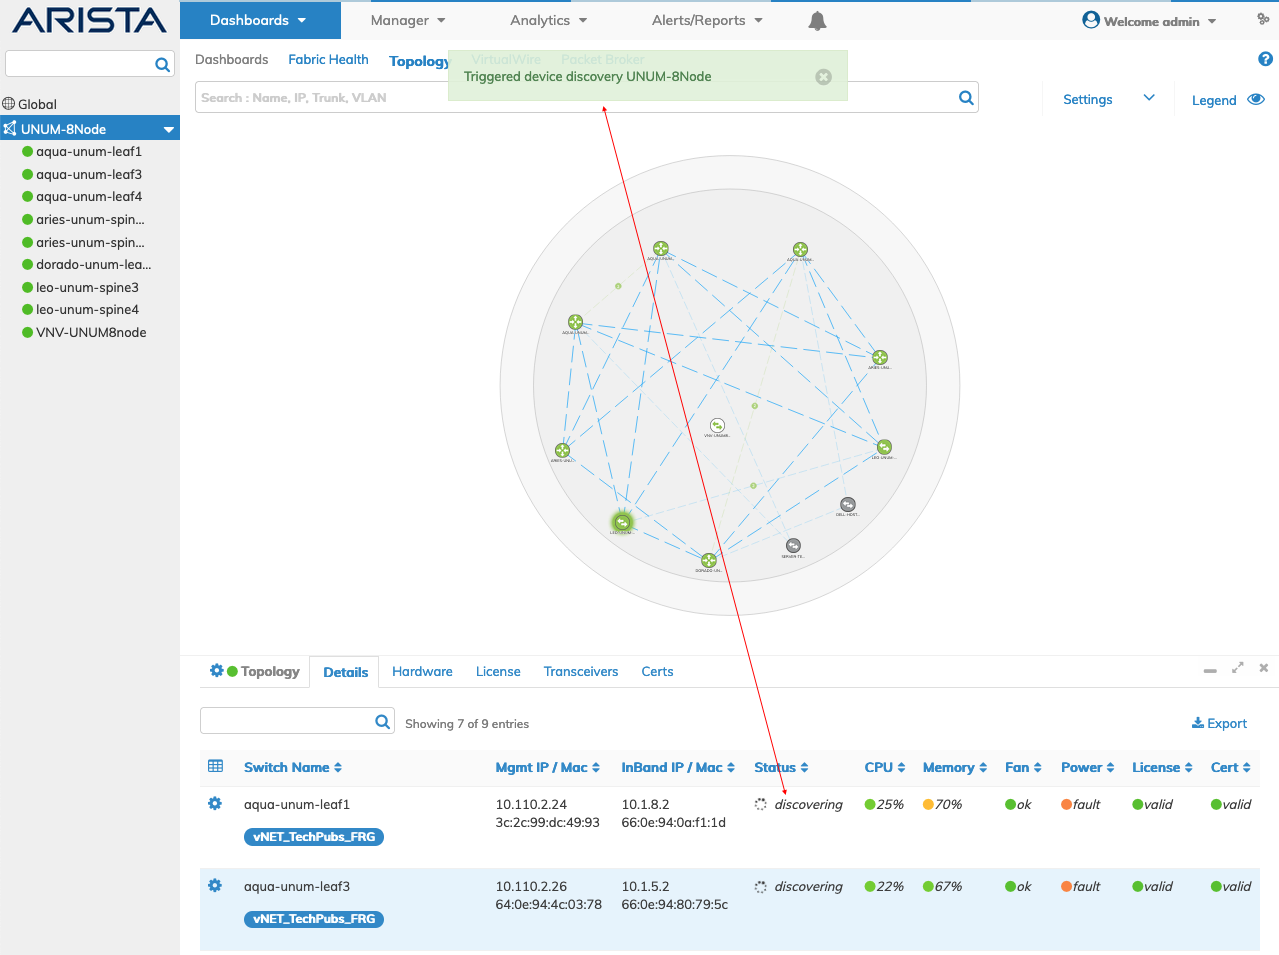
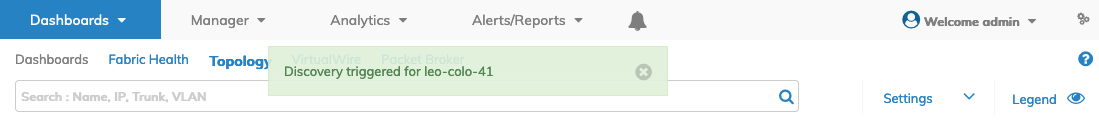
To trigger a Fabric discovery use the Cog ![]() icon and click Trigger Fabric Discovery.
icon and click Trigger Fabric Discovery.
A confirmation message appears and the discovery process begins as shown in the following example.
Topology - Trigger Discovery
Delete a Fabric
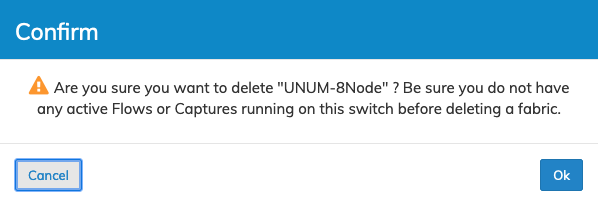
To delete a Fabric use the Cog ![]() icon and click Delete.
icon and click Delete.
A confirmation window is displayed. Click OK to delete the Fabric or Cancel to return to the previous screen without making any changes.
NetVisor UNUM Platform Global - Delete Fabric
Details Tab
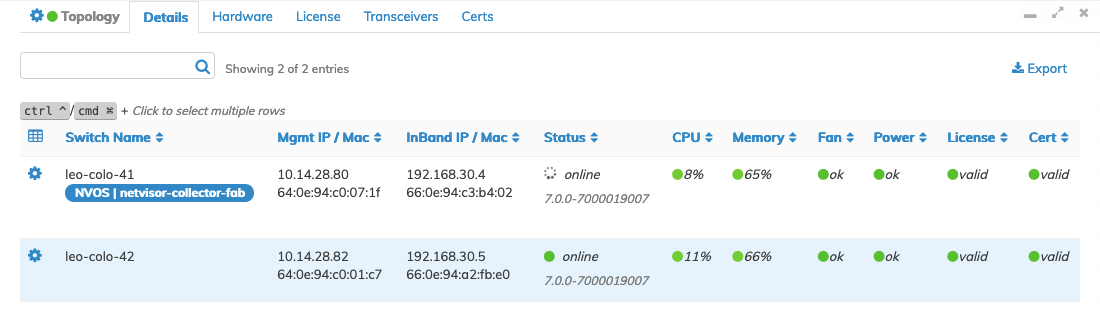
Clicking on Details updates the display to provide extensive details about the Fabric and the switches.
Details include:
•Switch Name – The name of the device.
•Mgmt IP/Mac – The management IP address and the associated MAC address.
•Inband IP/Mac – The Inband IP address and the associated MAC address.
•Status – Condition of the device, online, offline or discovery failure condition (see visual indicators explanation below) and the current software version running on the device.
•CPU – CPU load. (see visual indicators explanation below).
•Memory – Memory Load (see visual indicators explanation below).
•Fan – Fan status (see visual indicators explanation below).
•Power – Power Supply status(see visual indicators explanation below).
•License – Switch NetVisor OS license status (see visual indicators explanation below).
•Cert – Switch certificate status (see visual indicators explanation below).
Topology Details Status Conditions
Rolling over a visual status indicator provides more granular details as to the nature of the fault as shown below.

Topology Details Status Conditions Rollover
Visual indicators in the Details pane provide critical information about switch load and status, interface traffic, and interface errors in Red, Yellow, Orange, Green, or Gray.
Visual Status Indicators
•Status – online/offline with green, red, and alarm indicators.
•CPU – stated percentage with respective green, yellow, red indicators (can also indicate offline).
•Memory – stated percentage with respective green, yellow, red indicators (can also indicate offline).
•Fan – stated number of fan faults with respective green, orange and red indicators (can also indicate offline).
•Power – stated number of power supply faults with respective green, orange and red indicators (can also indicate offline).
•License – stated in terms of valid, invalid or, not_found with respective green and red indicators (can also indicate offline).
•Cert – stated in terms of valid, invalid, offline, unknown or, not_found with respective green, gray and red indicators (can also indicate offline).
CPU and Memory % Color Code Logic:
•If the percentage is >=0 and < 70 the status condition is Green.
•If the percentage is >=70 and < 90 the status condition is Yellow.
•If the percentage is >=90 and <= 100 the status condition is Red.
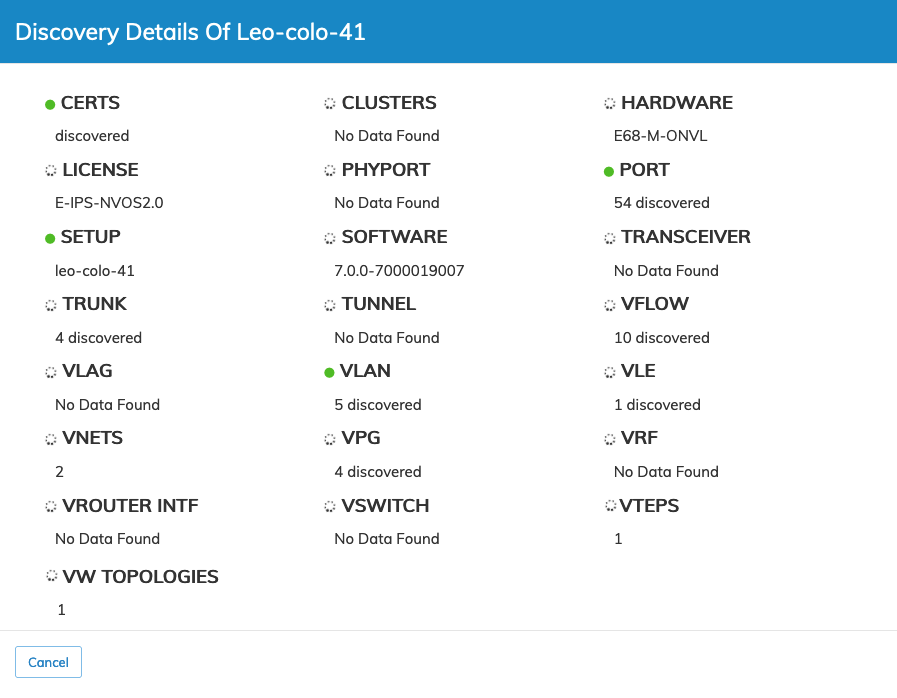
Clicking on Green visual indicator ![]() in the Status column opens a Discovery Details window for the device.
in the Status column opens a Discovery Details window for the device.
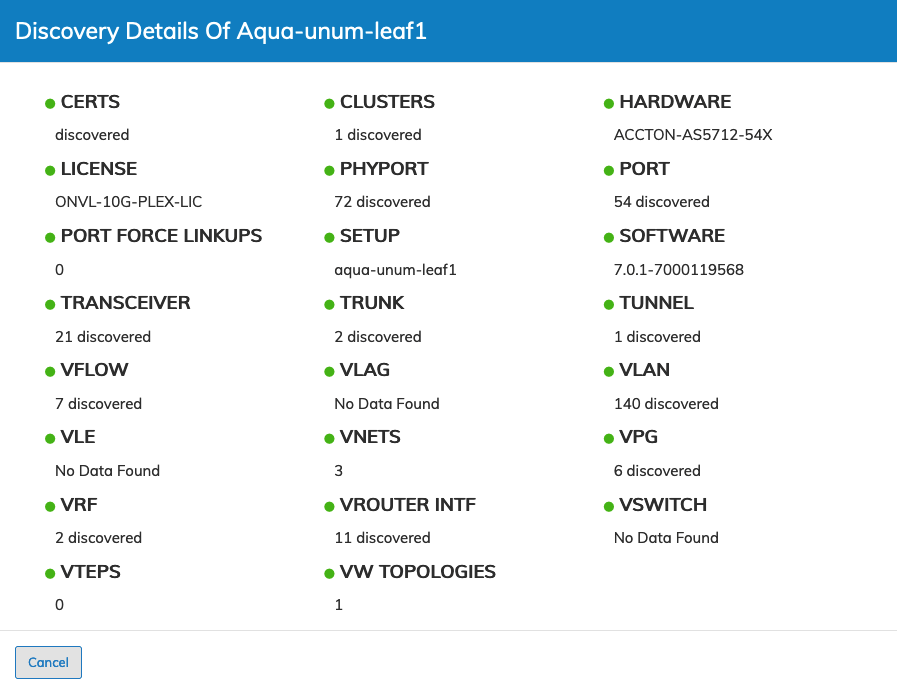
Topology Details Discovery Details
Switch discovery details include:
|
CERTS |
CLUSTERS |
HARDWARE |
|
LICENSE |
PHYPORT |
PORT |
|
PORT FORCE LINKUPS |
SETUP |
SOFTWARE |
|
TRANSCEIVER |
TRUNK |
TUNNEL |
|
VFLOW |
VLAG |
VLAN |
|
VLE |
VNETS |
VPG |
|
VRF |
VROUTER INTF |
VSWITCH |
|
VTEPS |
VW TOPOLOGIES |
|
Click Cancel to return to the Details pane.
An Alert ![]() visual indicator shows a problem a device.
visual indicator shows a problem a device.
Clicking on the Alert ![]() in the Status column opens a Discovery Details window for the device.
in the Status column opens a Discovery Details window for the device.
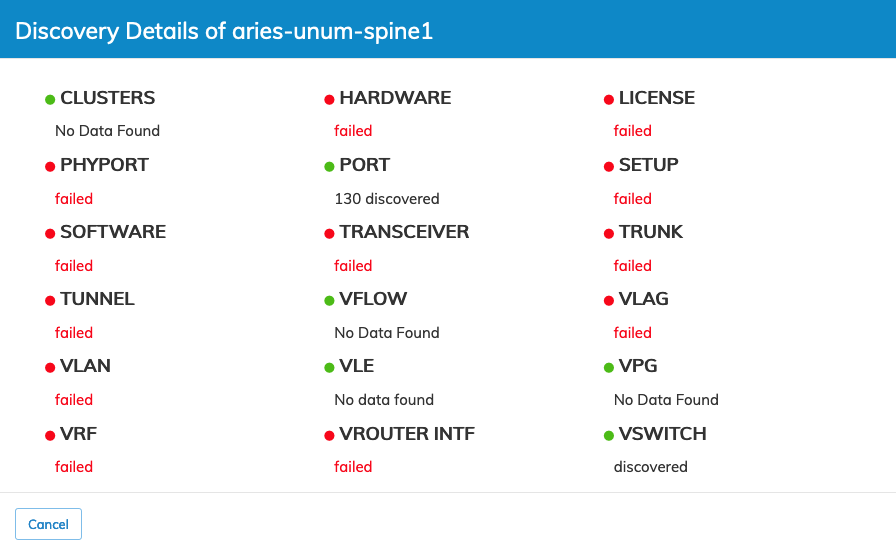
Topology Details Discovery Details - Discovery Error
Click Cancel to return to the Details pane.
Fabric Resource Groups (FRG)
Refer to the Manage Groups section to create, use and manage Fabric Resource Groups (FRG).
The FRG feature provides the ability to configure multiple switches and ports in a Fabric or across multiple fabrics. This approach makes it easier to manage switches, ports, and Fabrics.
When FRGs exist, they display in the Details dashboard. Various switches may have different FRGs managing them, as illustrated below.
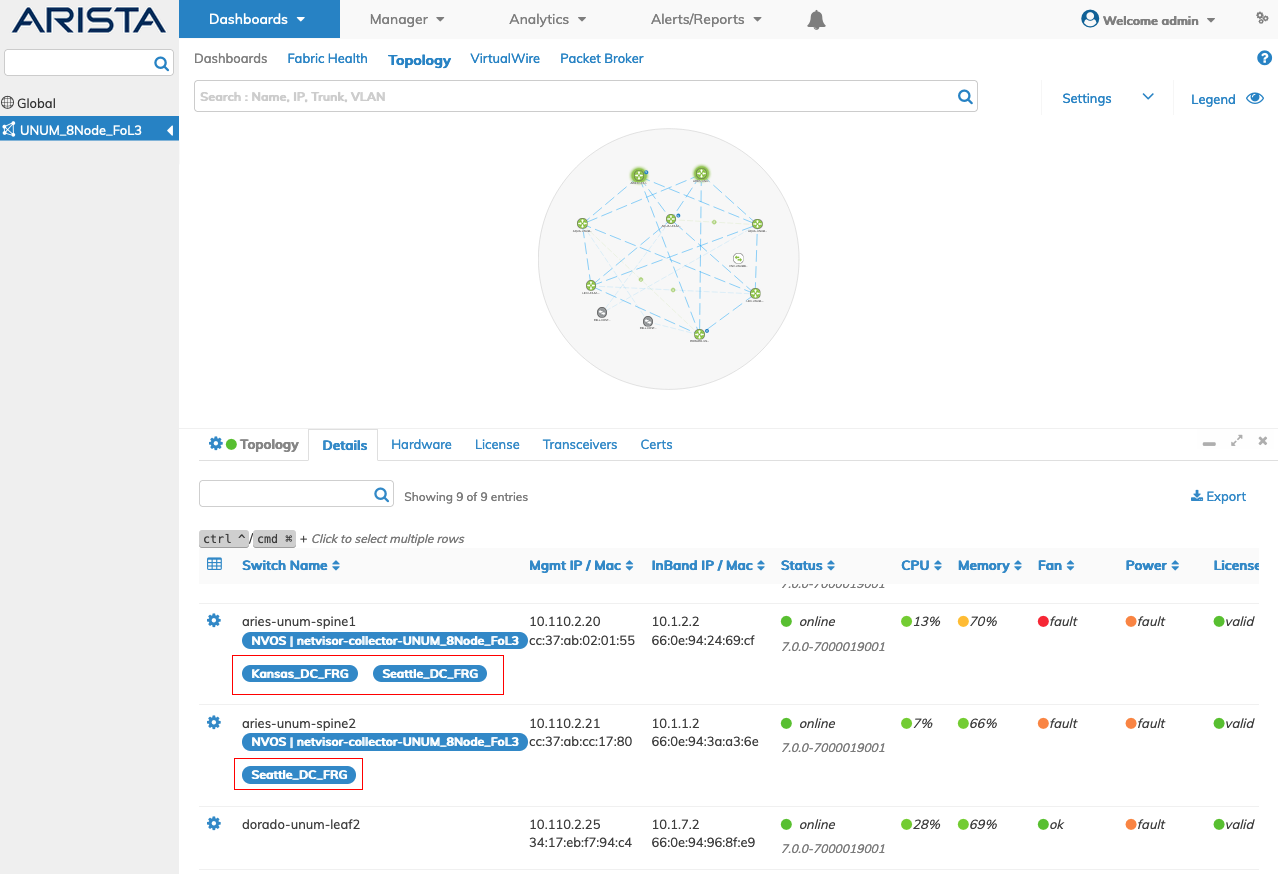
NetVisor UNUM Topology Details Pane - Fabric Resource Groups (FRG)
Trigger Device Discovery
To trigger a device discovery of an individual switch select the applicable switch entry using the Cog ![]() icon and click Trigger Device Discovery.
icon and click Trigger Device Discovery.
A confirmation message appears and the discovery process begins.
Topology Map Individual Switch Discovery Confirmation Message
Click on "discovering" in the dashboard entry to view the discovery panel.
Topology Map Individual Switch Discovery Mode
Topology Map Individual Switch Discovery Panel
Hardware
Select the Hardware tab to update the dashboard with hardware information and status about the individual devices.
Hardware device parameters include:
•Switch Name
•Device Id
•Model
•CPUs
•System Memory
•Disk Model / Size / Firmware
•Fan Status (multiple columns)
•Power Supply Status (multiple columns)
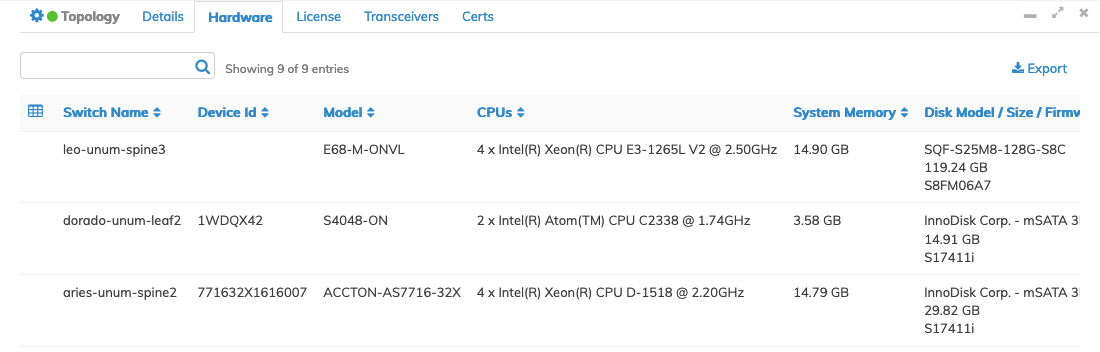
Topology Map Hardware Details
License
Select the License tab to update the dashboard with license detail and the license status per individual device.
License details include:
•Switch Name
•License Id
•Expires On
•Status
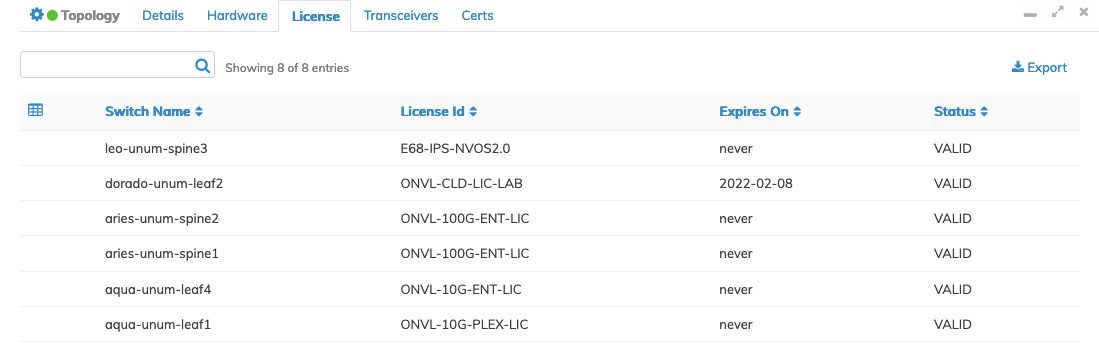
Topology Map License Details
License Notifications
NetVisor UNUM displays the following license status results after a Topology discovery process.
|
Valid License |
No notifications triggered. |
|
Expired License |
Notification is displayed in Alarm Bell with switch and license details. Appears in the All Notifications dashboard. |
|
License in Grace Period |
Notification is displayed in the Alarm Bell with periodic messages. Appears in the All Notifications dashboard. |
|
Expired Seed Switch License |
Communication failure is displayed in the Alarm Bell. Appears in the All Notifications dashboard. |
Warning: A license grace period occurs ten days before expiry and five days after.
Transceivers
Select the Transceivers tab to update the dashboard with transceiver details and the type of transceiver installed per individual device.
Transceiver details include:
•Switch Name
•Port
•Vendor Name
•Part Number
•Serial Number
![]()
Topology Map Transceiver Details
Certs (Certificates)
Select the Certs tab to update the dashboard with the certificate details of the certs installed on the Fabric.
Certificate details include:
•Switch Name
•Switch Cert / Serial Number / Cert Type / Subject / Issuer / Valid From / Valid To / Status
•Core Cert / Serial Number / Cert Type / Subject / Issuer / Valid From / Valid To / Status
•CA Cert / Serial Number / Cert Type / Subject / Issuer / Valid From / Valid To / Status
•CA Certs / Serial Number / Cert Type / Subject / Issuer / Valid From / Valid To / Status
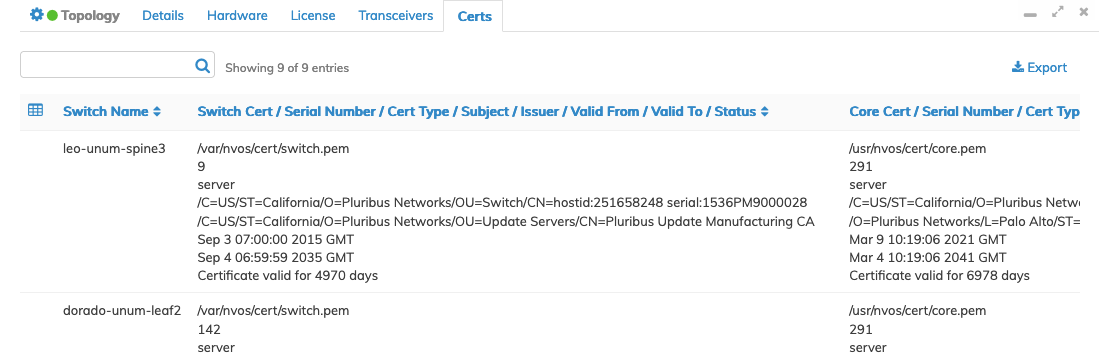
Topology Map Certificate Details
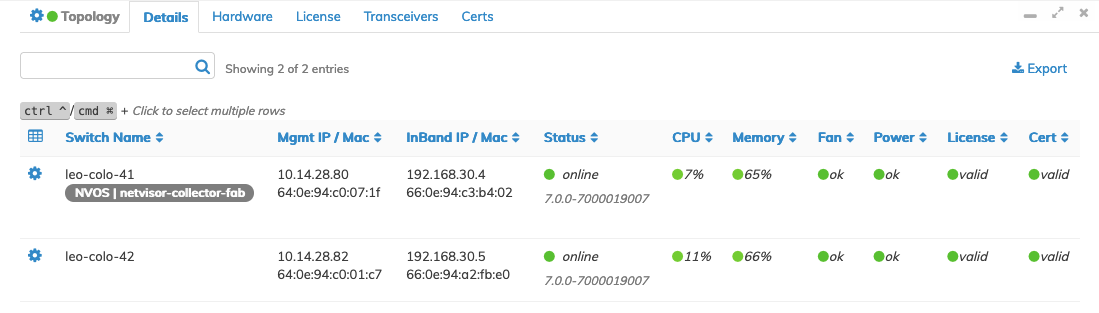
Active Collector
The details dashboard displays an active running Collector in Blue.
Details include the switch name and the rollover pop-up displays the management connection type.
NetVisor UNUM Topology Map Visual Indicators - Active Collector
Conversely, a non-running or inactive Collector displays in Gray.
NetVisor UNUM Topology Map Visual Indicators - Inactive Collector
Rollovers
Rolling over the Seed Switch / Collector in the dashboard reveals the type of connection used, mgmt or in-band, while rolling over an entry in the MgmtIP/Mac or Inband/Mac reveals the Netmask.
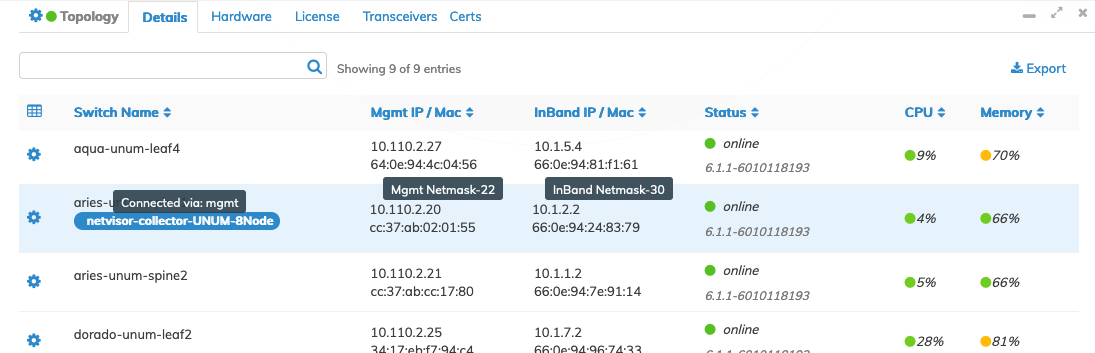
NetVisor UNUM Topology Details Pane - Rollovers