
Flow - Connections
Insight Analytics Flow Connections
There are features and functions used in Arista NetVisor UNUM and Insight Analytics that are common throughout the user interface (UI). Please refer to the Common Functions section for more information on the use of these functions and features.
Selecting Analytics → Insight Analytics Flow → Connections displays the Flow Connections dashboard.
The Connections tab is displayed by default.
Select the applicable Fabric from the left-hand navigation bar and the dashboard updates showing data entries from all switches within the Fabric.
Usage Note: Before any analytics are collected, add a Fabric and install and activate a valid license.
Overall, the Connections tab displays the following information:
•Insight – Top L4 Services by Connections – displays L4 service types.
•Insight – Top Clients by Connections – displays the top client connections by host name.
•Insight – Connection Count – total count of all connections.
•Insight – L4 Services Count – unique count of L4 services.
•Insight – Top Domains by Connections – displays the top domains such as pluribusnetworks.com.
•Insight – Top Servers by Connections – displays the server with the highest number of connections in descending order.
•Insight – Top Servers by Total Unique Clients – bar graph of top servers by total unique clients.
•Insight – Connections by State – displays the types of connection states as FIN, RST, SYN, or EST.
•Insight – Top Switches by Total # of Connections – displays the total number of connections per switch.
•Insight – Top L4 Services by Total Unique Clients – bar graph of top L4 services by total unique clients.
•Connections Timeline by State– count of connections in the following states: RST, FIN, SYN, and EST.
•Top Servers by Average Connection Latency in µsecs – displays the servers with average latency in microseconds.
•Insight Details – data drill-down of connection and switch information.
The upper Connections dashboard widgets include:
•Insight – Top L4 Services by Connections – displays L4 service types.
•Insight – Top Clients by Connections – displays the top client connections by host name.
•Insight – Connection Count – total count of all connections.
•Insight – L4 Services Count – unique count of L4 services.
•Insight – Top Domains by Connections – displays the top domains such as pluribusnetworks.com.
•Insight – Top Servers by Connections – displays the server with the highest number of connections in descending order.
•Insight – Top Servers by Total Unique Clients – bar graph of top servers by total unique clients.
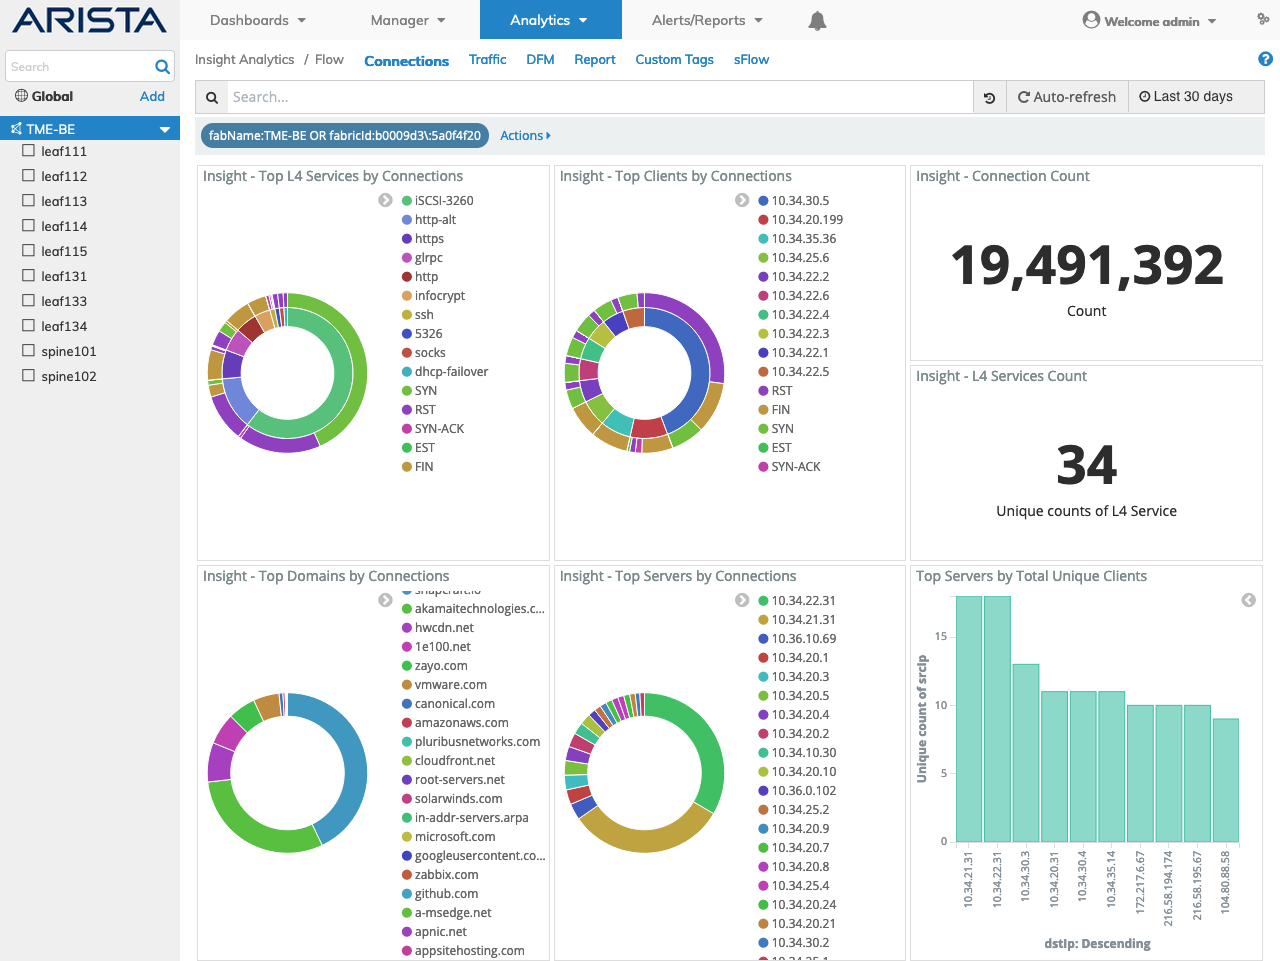
Insight Analytics Flow Connections Upper Dashboard
The middle Connections dashboard widgets include:
•Insight – Connections by State – displays the types of connection states as FIN, RST, SYN, or EST.
•Insight – Top Switches by Total # of Connections – displays the total number of connections per switch.
•Insight – Top L4 Services by Total Unique Clients – bar graph of top L4 services by total unique clients.
•Connections Timeline by State– count of connections in the following states: RST, FIN, SYN, and EST.
•Top Servers by Average Connection Latency in µsecs – displays the servers with average latency in microseconds.
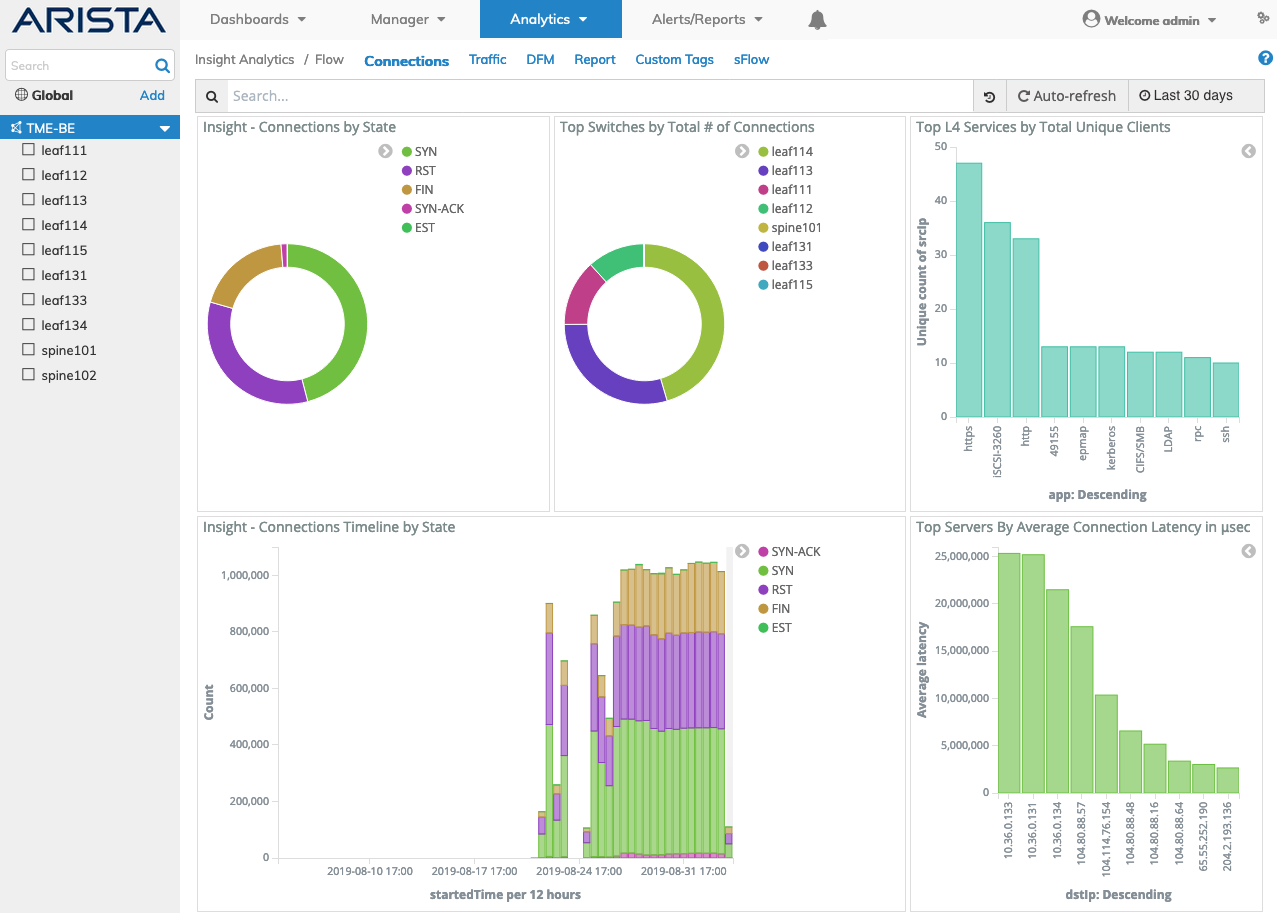
Insight Analytics Flow Connections Middle Dashboard
The lower Connections dashboard widgets include:
•Insight Details – data drill-down of connection and switch information.
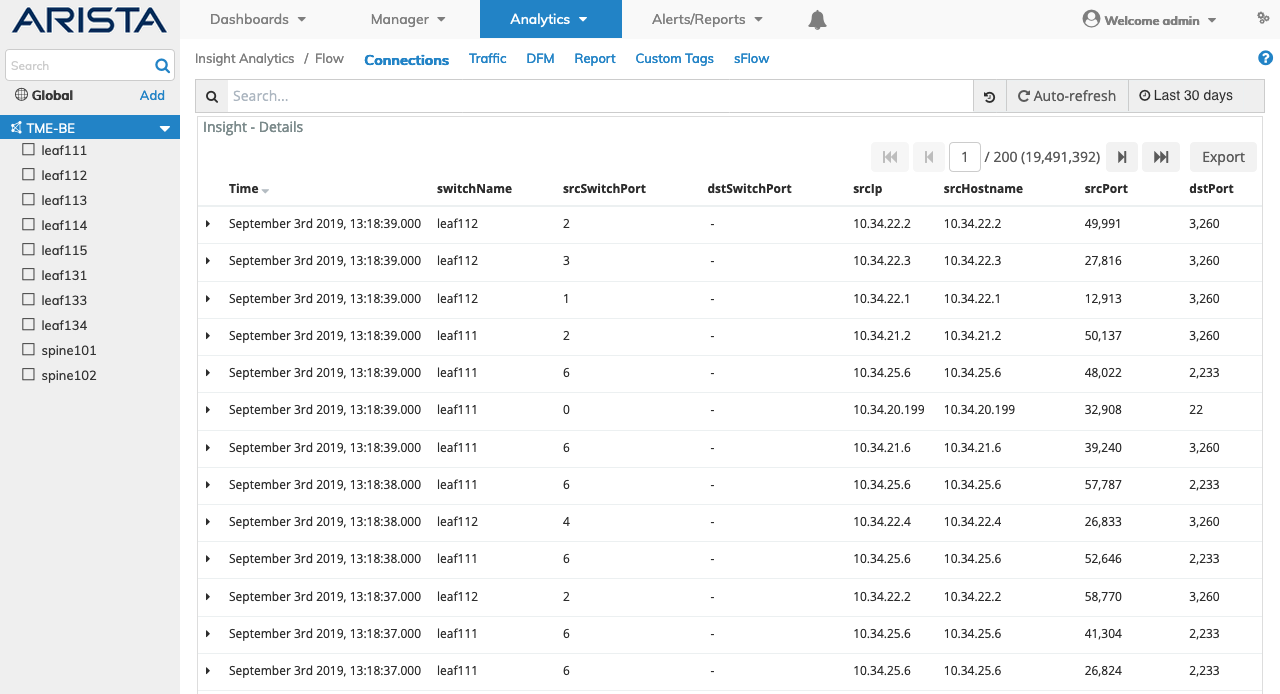
Insight Analytics Flow Connections Lower Dashboard
Selecting a Switch within the Fabric automatically updates the Insight Analytics Connections dashboard with information from the selected switch.
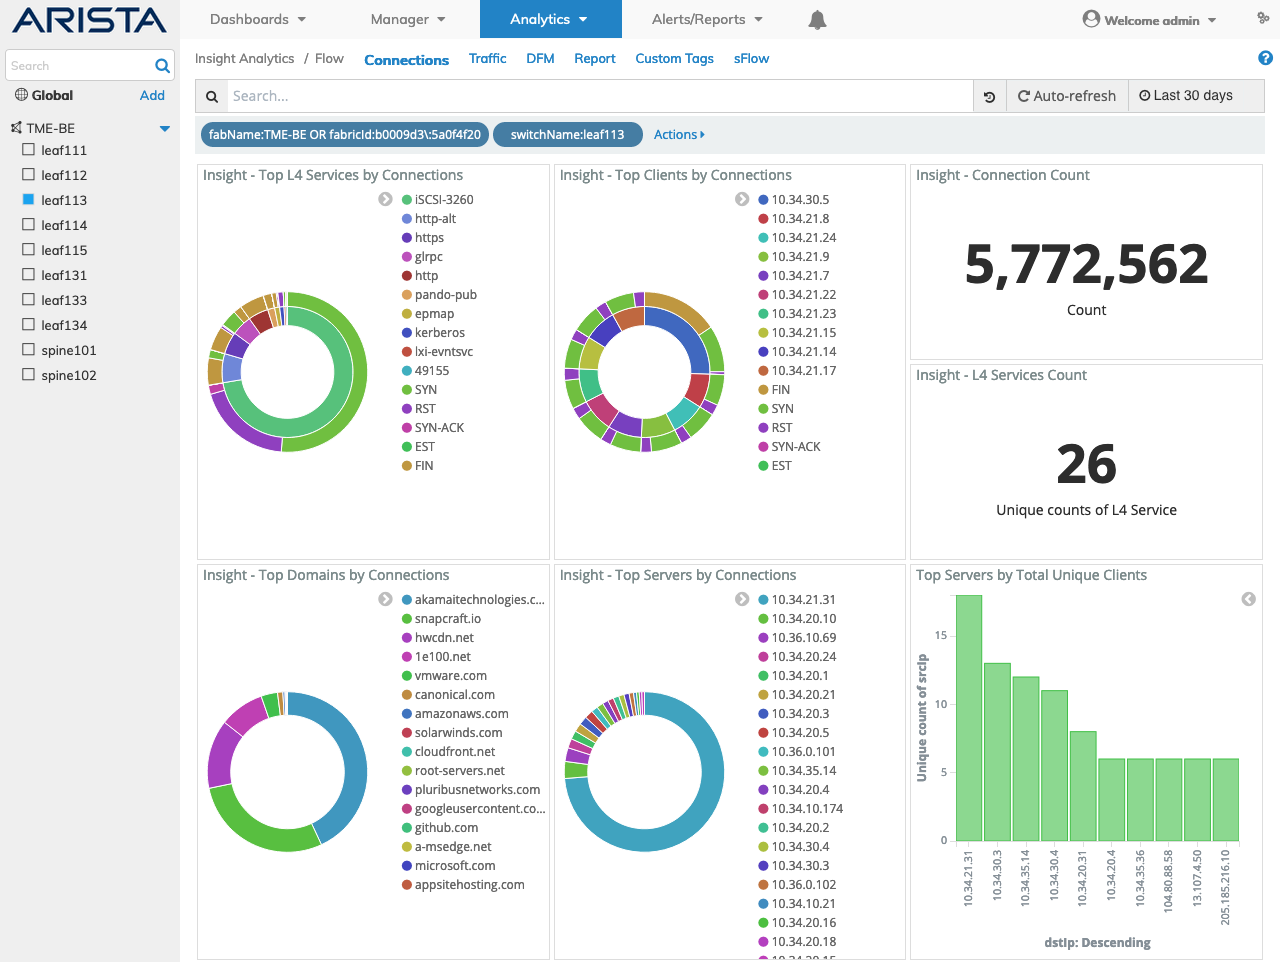
Insight Analytics Flow Connections Switch Dashboard
Insight Analytics Flow General Features
Each individual tile contains a pie chart with a color legend that labels each slice of information with a specific color.
When you place your cursor over a name in the legend, the corresponding slice highlights in the pie chart.
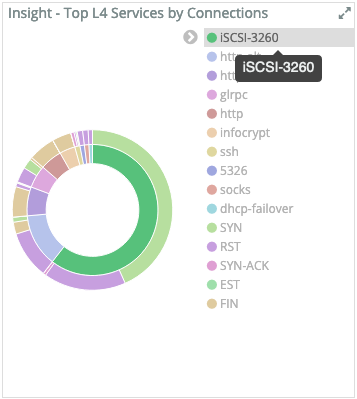
Insight Analytics Flow General Feature Rollover Legend Name
Clicking on a pie slice applies a global filter to the entire Dashboard.
Note the change in Connection Count and L4 Services Count.
Insight Analytics Flow General Feature Data Drill Down
Widget Expand Feature
You expand and contract widgets by clicking on the ![]() icon. Enlarge dashboard widgets for better viewing using the sizing arrows.
icon. Enlarge dashboard widgets for better viewing using the sizing arrows.
Insight Analytics Flow General Feature Widget Expand
Dashboard Widget Rollover
Rolling over data areas of pie charts and/or bar charts reveals more granular information and statistics.
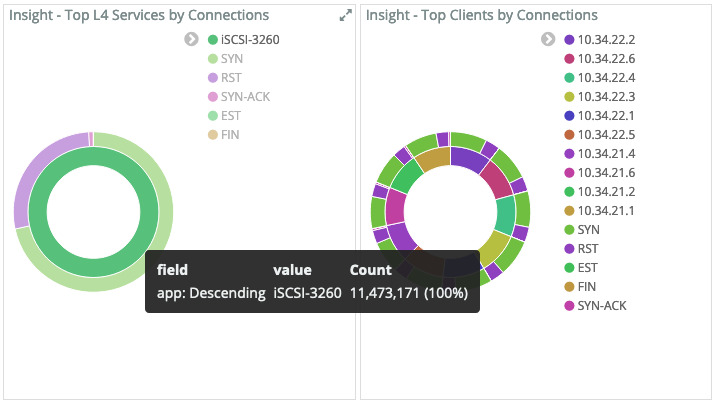
Insight Analytics Flow General Feature Widget Rollover
Drilling Down into the Dashboard - Examples
Once you understand the information displayed in the Dashboard, you drill down into the information and analyze your network.
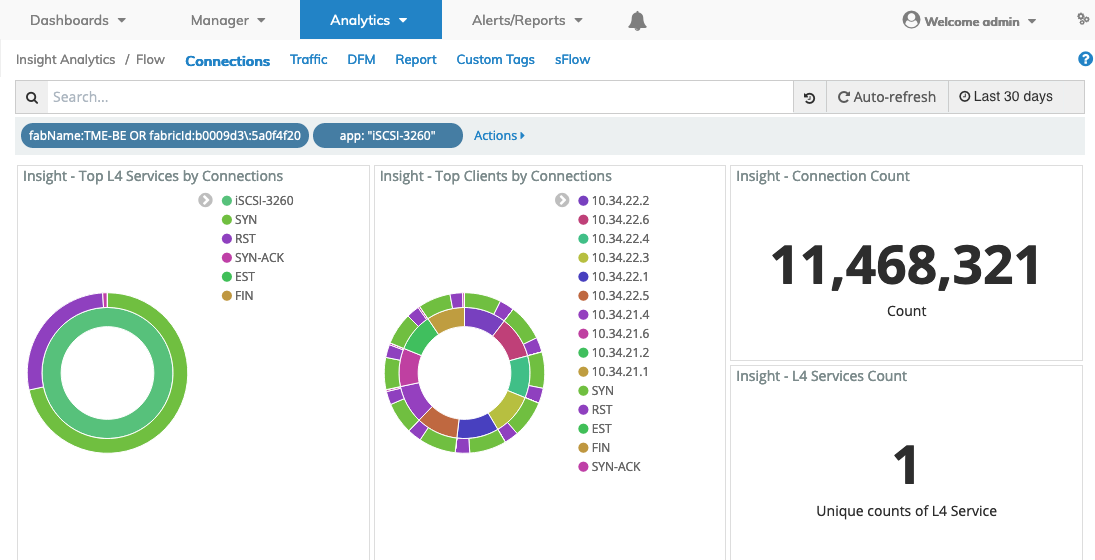
To filter the entire Dashboard based on one of the Top Apps such as HTTPS (in the example below), click HTTPS in the Top L4 Services by Connections tile.
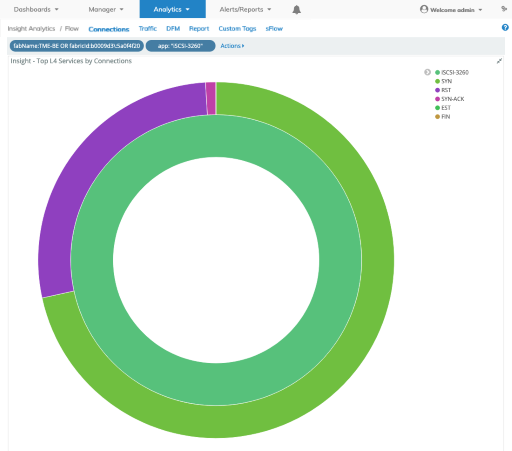
The Dashboard displays a filter at the top and the pie chart changes to reflect only L4 services (apps) using HTTPS.
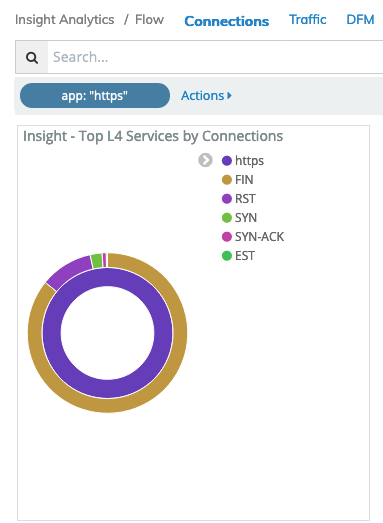
Insight Analytics Flow Dashboard Drill Down - Top L4 Services
The App Count changes as well as the Connection Count, Connection Latency, and Connections Timeline by State:
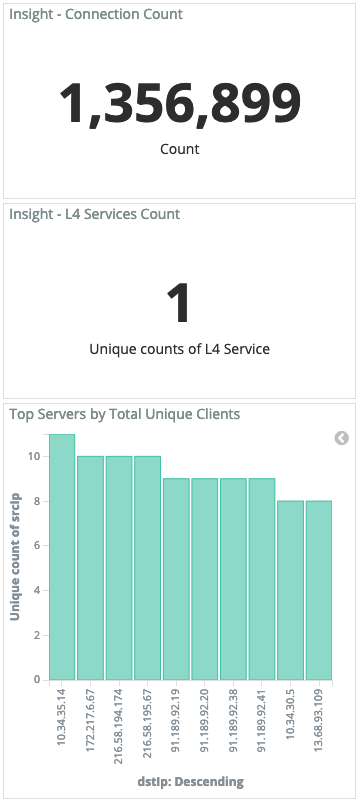
Insight Analytics Flow Dashboard Drill Down - Connection Latency
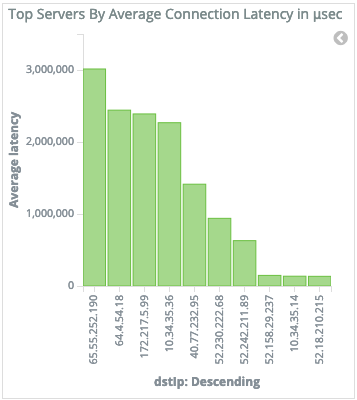
Insight Analytics Flow Dashboard Drill Down - Top Servers by Average Connection Latency
To display information about the top server with the highest latency in Top Servers by Average Connection Latency, you position your cursor over the IP address and the dashboard changes to reflect the server with the highest latency.
Also as you drill down, the Details at the bottom of the Dashboard change to reflect this information.
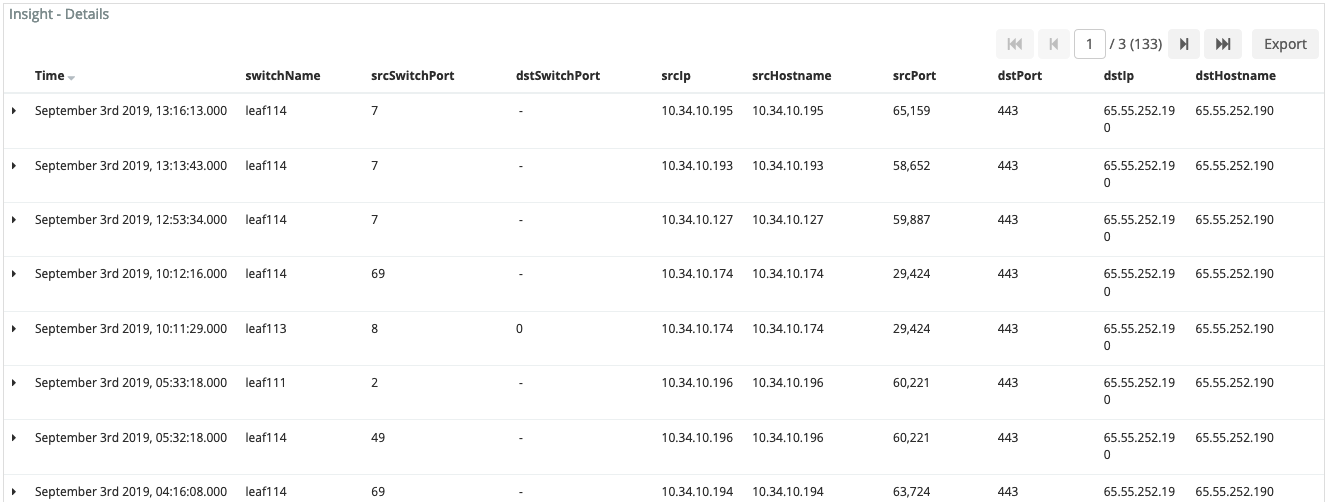
Insight Analytics Flow Drill Down Details Dashboard
To reset the Dashboard, remove the Filter by clicking on the filter menu item and selecting the Trash Bin ![]() icon. By doing so all traffic is displayed again.
icon. By doing so all traffic is displayed again.
The Insight Details table is customizable using the following features:
|
|
|
|
|
|
|
|
|
|
|
|
Insight Analytics Flow Details Dashboard
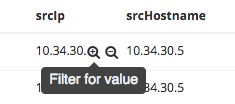
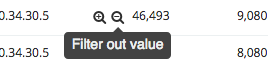
Rolling over a column in theDetails section reveals a ![]() icon used to Add or Remove filters from the search criteria.
icon used to Add or Remove filters from the search criteria.
Clicking on the ![]() icon in the Details section reveals Tabular and JSON data.
icon in the Details section reveals Tabular and JSON data.
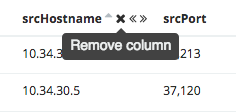
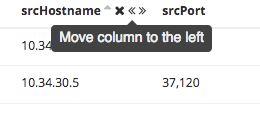
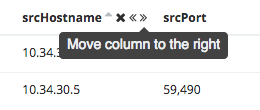
Move each column to the right or left using the << x >> symbols displayed next to the column name. Click the x to remove the column from the display.
FlowTracker
Note: FlowTracker must be enabled on each switch to collect the required analytics data. By default, the FlowTracker feature is disabled. Reboot the switch after enabling the FlowTracker feature.
Starting from NetVisor OS 7.0.1 version, support for non-TCP analytics is available with the introduction of the FlowTracker feature. The main objective of the FlowTracker feature is to extend the Arista Insight Analytics solution beyond TCP to ensure visibility into DNS/ DHCP, generic UDP, and ICMP echo traffic.
This extended analytics capability collects information about the non-TCP flows and creates statistical data using the Exact Match sub-system. FlowTracker creates 5-tuples (source IP address, destination IP address, source port number, destination port number, and the protocol in use) flow entries in Exact-match sub-system in the hardware. The hardware preserves the packet and bytes statistics for the flow. The software performs the periodic fetching of the required data, and as such, the data displayed in NetVisor UNUM is not real-time.
The FlowTracker feature for non-TCP analytics is available on the following platforms in NetVisor OS version 7.0.1:
•Dell: S5232F-ON, S5248F-ON
•Ericsson: NRU03, NRU-S0301
•Edgecore: AS7726-32X, AS7326-56X, AS5835-54X, AS5835-54T
•Freedom: F9432-C, F9480-V, F9460-X, F9460-T
FlowTracker monitors the following protocols:
•DNS
•NTP
•DHCP
•ping4
•UDP
•ping6
•DHCPv6
While showing DHCP or a DNS, NetVisor UNUM displays the protocol as UDP, whereas for ICMP, the protocol displays as ICMP.
System vFlow entries identify the broad family of protocols of interest (DHCP, DNS, and other generic UDP flows) for the analytics. The software extracts a signature for the flow from the packet, which consists of the source IP address, destination IP address, destination (dest) port, source (src) port, protocol, and ICMP type-code (in case of ICMP).
Note: Each entry is visited once in 8 seconds. During each second, stats are collected for a maximum of 4000 entries.
Limitations and Guidelines
The non-TCP flows are first matched using vFlows and hence have the following limitations: The first packet of the flow copies to the switch CPU, which causes CPU load and bandwidth utilization of vFlow queues.
Exact Match does not work with VXLAN encapsulated packets, and hence the solution can work only on leaf nodes.
FlowTracker Example
Note: You must enable Flow Tracker Enable – Enable Flow Tracker Feature in the System - Manage System Settings menu.
Add and manage the FlowTracker protocols using the Manager → Services → FlowTracker - FlowTracker Protocol function.
In the following example, iperf traffic is sent from client sv23 (172.18.10.4 - sending) to server sv22 (172.18.10.2 - listening).
Client
|
root@sv23:~# iperf -c 172.18.10.2 -u -t 3 -i .2 ------------------------------------------------------------ Client connecting to 172.18.10.2, UDP port 5001 with pid 878 Sending 1470 byte datagrams, IPG target: 11215.21 us (kalman adjust) UDP buffer size: 208 KByte (default) ------------------------------------------------------------ [ 3] local 172.18.10.4 port 59660 connected with 172.18.10.2 port 5001 [ ID] Interval Transfer Bandwidth PPS [ 3] 0.00-0.20 sec 27.3 KBytes 1.12 Mbits/sec 94 pps [ 3] 0.20-0.40 sec 25.8 KBytes 1.06 Mbits/sec 89 pps [ 3] 0.40-0.60 sec 25.8 KBytes 1.06 Mbits/sec 89 pps [ 3] 0.60-0.80 sec 25.8 KBytes 1.06 Mbits/sec 89 pps [ 3] 0.80-1.00 sec 25.8 KBytes 1.06 Mbits/sec 89 pps [ 3] 1.00-1.20 sec 24.4 KBytes 1000 Kbits/sec 89 pps [ 3] 1.20-1.40 sec 25.8 KBytes 1.06 Mbits/sec 89 pps [ 3] 1.40-1.60 sec 25.8 KBytes 1.06 Mbits/sec 89 pps [ 3] 1.60-1.80 sec 25.8 KBytes 1.06 Mbits/sec 89 pps [ 3] 1.80-2.00 sec 25.8 KBytes 1.06 Mbits/sec 89 pps [ 3] 2.00-2.20 sec 25.8 KBytes 1.06 Mbits/sec 89 pps [ 3] 2.20-2.40 sec 24.4 KBytes 1000 Kbits/sec 89 pps [ 3] 2.40-2.60 sec 25.8 KBytes 1.06 Mbits/sec 89 pps [ 3] 2.60-2.80 sec 25.8 KBytes 1.06 Mbits/sec 89 pps [ 3] 2.80-3.00 sec 25.8 KBytes 1.06 Mbits/sec 89 pps [ 3] 0.00-3.02 sec 386 KBytes 1.05 Mbits/sec 89 pps [ 3] Sent 269 datagrams [ 3] Server Report: [ 3] 0.0- 3.0 sec 386 KBytes 1.05 Mbits/sec 0.000 ms 0/ 269 (0%) root@sv23:~# |
Server
|
root@sv22:~# iperf -s -u -B 172.18.10.2 ------------------------------------------------------------ Server listening on UDP port 5001 Binding to local address 172.18.10.2 Receiving 1470 byte datagrams UDP buffer size: 208 KByte (default) ------------------------------------------------------------ [ 3] local 172.18.10.2 port 5001 connected with 172.18.10.4 port 59660 [ ID] Interval Transfer Bandwidth Jitter Lost/Total Datagrams [ 3] 0.0- 3.0 sec 386 KBytes 1.05 Mbits/sec 0.036 ms 0/ 269 (0%) |
Selecting Analytics → Insight Analytics Flow → Connections displays the Flow Connections dashboard with the iperf traffic displayed in the Top L4 Services by Connections panel.
The Connection Count is 2 while the L4 Services Count is 1.
![]()
Insight Analytics Flow Details Dashboard - iperf Traffic Example
The Insight Details pane displays the connection information.
![]()
Insight Analytics Flow Details Dashboard - iperf Traffic - Details Example
Repeated iperf traffic to the server updates the Top L4 Services by Connections panel, accordingly.
Server
|
root@sv22:~# iperf -s -u -B 172.18.10.2 ------------------------------------------------------------ Server listening on UDP port 5001 Binding to local address 172.18.10.2 Receiving 1470 byte datagrams UDP buffer size: 208 KByte (default) ------------------------------------------------------------ [ 3] local 172.18.10.2 port 5001 connected with 172.18.10.4 port 59660 [ ID] Interval Transfer Bandwidth Jitter Lost/Total Datagrams [ 3] 0.0- 3.0 sec 386 KBytes 1.05 Mbits/sec 0.036 ms 0/ 269 (0%) [ 4] local 172.18.10.2 port 5001 connected with 172.18.10.4 port 57458 [ 4] 0.0- 3.0 sec 386 KBytes 1.05 Mbits/sec 0.061 ms 0/ 269 (0%) [ 3] local 172.18.10.2 port 5001 connected with 172.18.10.4 port 43627 [ 3] 0.0- 3.0 sec 386 KBytes 1.05 Mbits/sec 0.036 ms 0/ 269 (0%) [ 4] local 172.18.10.2 port 5001 connected with 172.18.10.4 port 47177 [ 4] 0.0- 3.0 sec 386 KBytes 1.05 Mbits/sec 0.032 ms 0/ 269 (0%) [ 3] local 172.18.10.2 port 5001 connected with 172.18.10.4 port 43652 [ 3] 0.0- 3.0 sec 386 KBytes 1.05 Mbits/sec 0.028 ms 0/ 269 (0%) [ 4] local 172.18.10.2 port 5001 connected with 172.18.10.4 port 36556 [ 4] 0.0- 3.0 sec 386 KBytes 1.05 Mbits/sec 0.022 ms 0/ 269 (0%) [ 3] local 172.18.10.2 port 5001 connected with 172.18.10.4 port 44602 [ 3] 0.0- 3.0 sec 386 KBytes 1.05 Mbits/sec 0.025 ms 0/ 269 (0%) [ 4] local 172.18.10.2 port 5001 connected with 172.18.10.4 port 52524 [ 4] 0.0- 3.0 sec 386 KBytes 1.05 Mbits/sec 0.027 ms 0/ 269 (0%) |
![]()
Insight Analytics Flow Details Dashboard - iperf Traffic Example Two - Additional Traffic
Changing the Time Selector to a longer period updates the count.
![]()
Insight Analytics Flow Details Dashboard - iperf Traffic Example Two - Increased Time Period
Kubernetes Analytics
Note: To view Kubernetes-specific connection data please review the following in the NetVisor UNUM Virtual Machine Configuration - Advanced Settings section.
|
Option 13: |
Enable or disable Kubernetes and VMWare visibility in the Insight Analytics Connections and Switch Analytics vPort tables. |
Kubernetes L4 Services by Connections
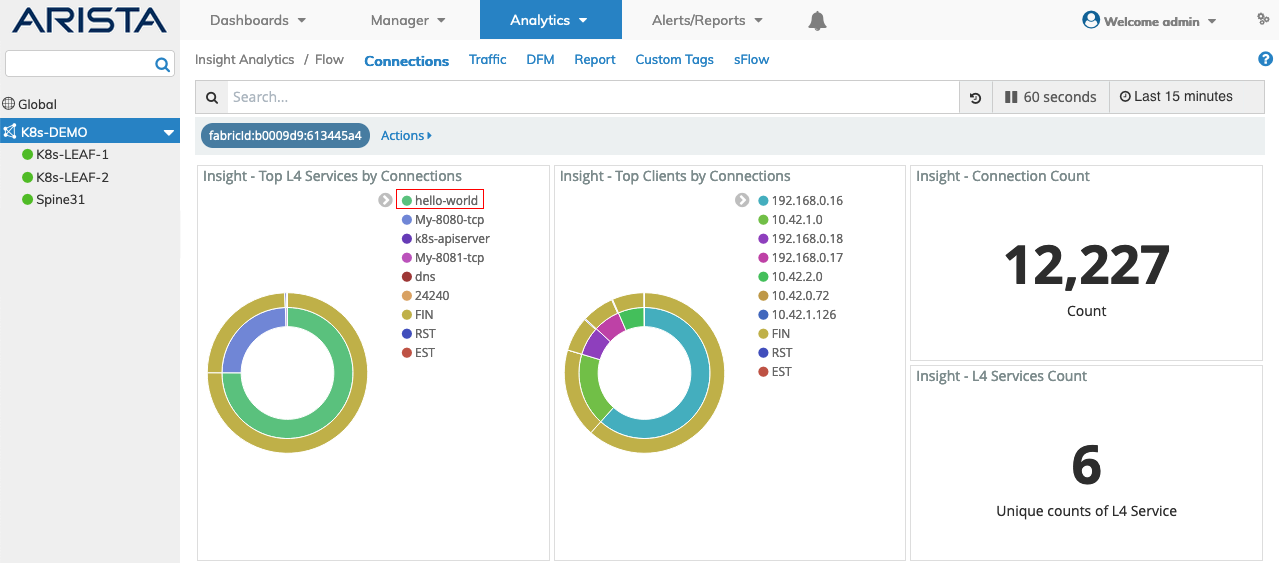
Insight Analytics Flow Details Dashboard - Top L4 Services by Connections
Kubernetes - K8s Service and Deployment Dashboards
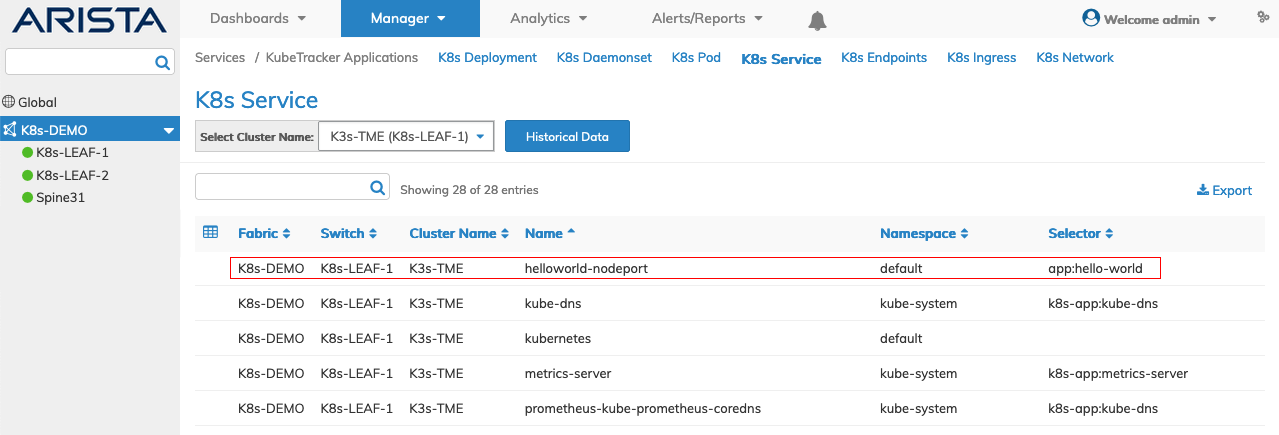
KubeTracker K8s Service - Hello World Example
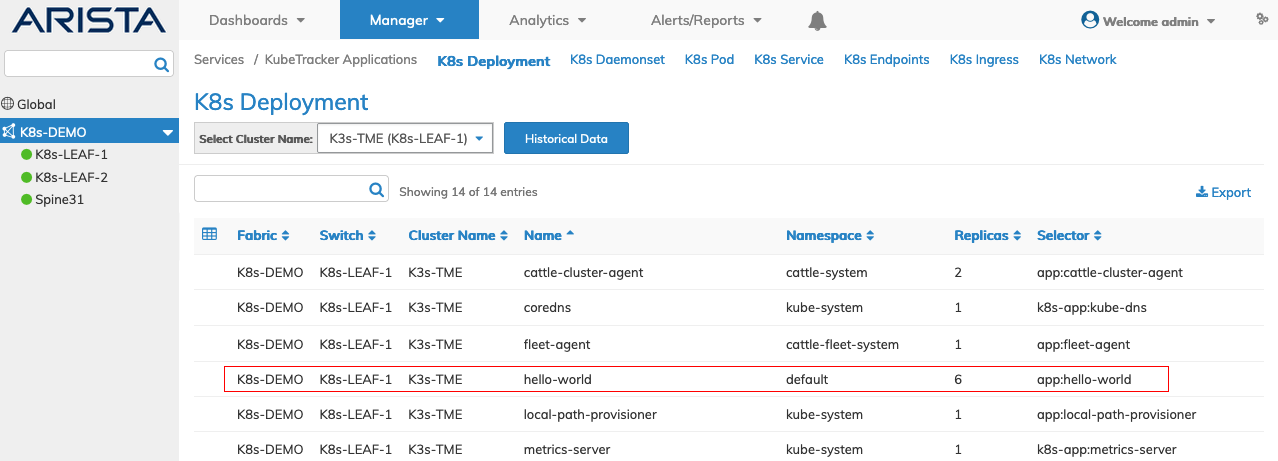
KubeTracker K8s Deployment - Hello World Example
Kubernetes Insight Analytics Drill-down
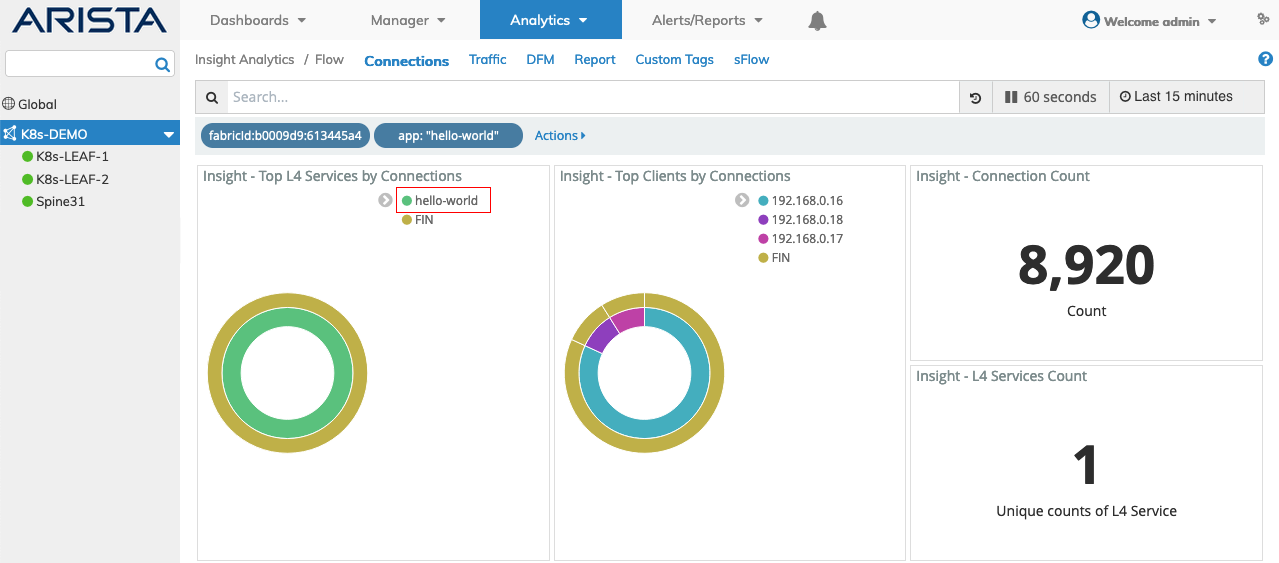
Insight Analytics Flow Details Dashboard - Top L4 Services by Connections - K8s Application
Kubernetes Insight Analytics - Details Dashboard
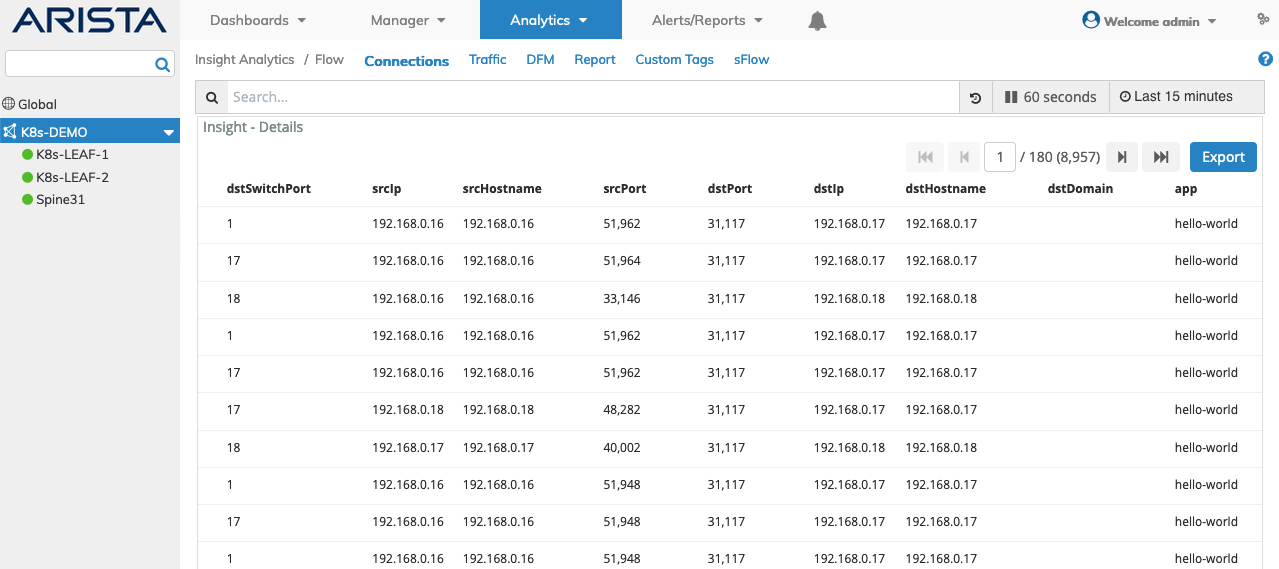
Insight Analytics Flow Details Dashboard - Details - K8s Application