
Configuring the Topology Map
Configuring the Topology Map
There are features and functions used in Arista NetVisor UNUM and Insight Analytics that are common throughout the user interface (UI). Please refer to the Common Functions section for more information on the use of these functions and features.
The section describes how to configure and interpret the Topology map using both the Settings and Legend tools.
Settings
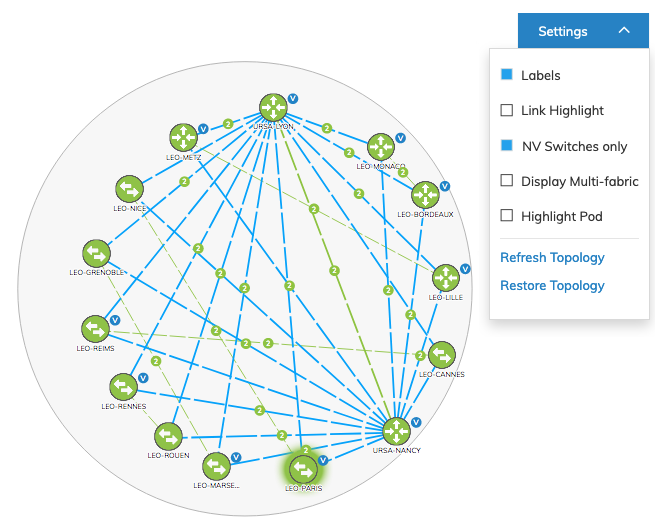
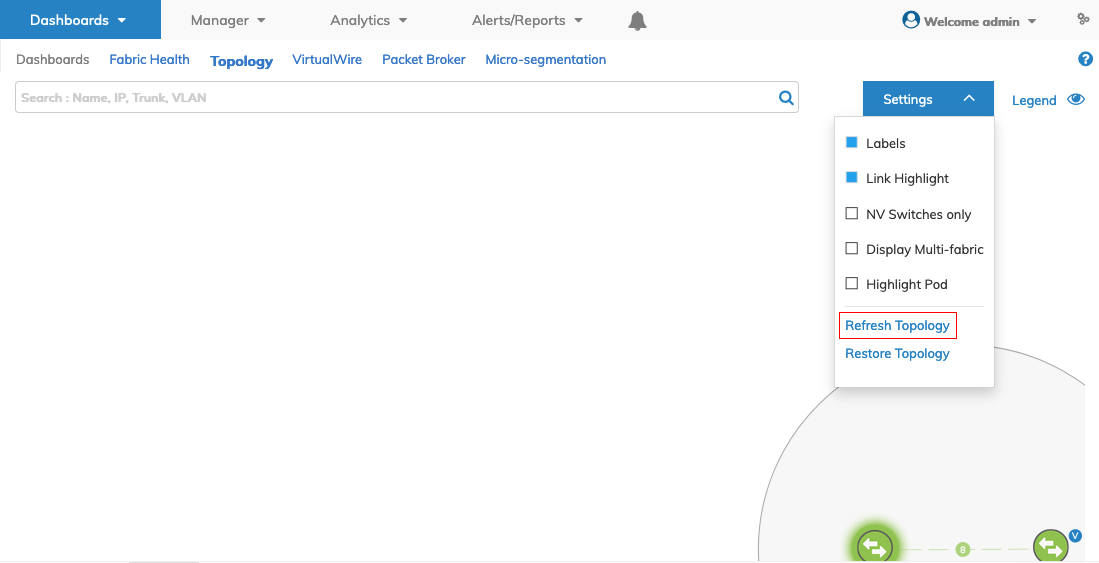
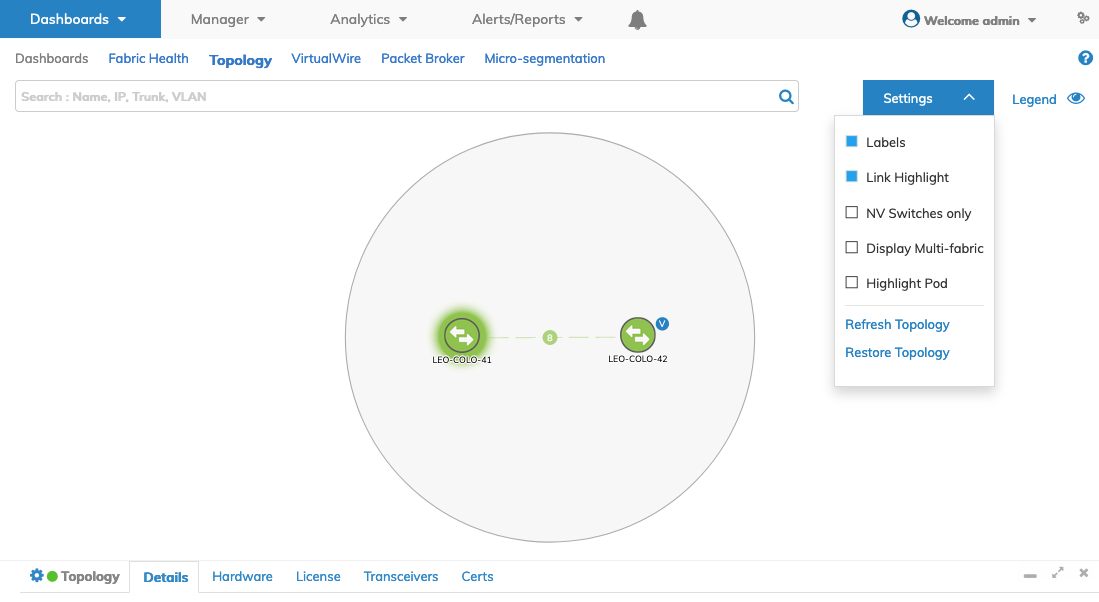
Selecting the Settings Up or Down arrow icons displays a list of display options for the Topology map, while the Legend describes the components used in the Topology Map.
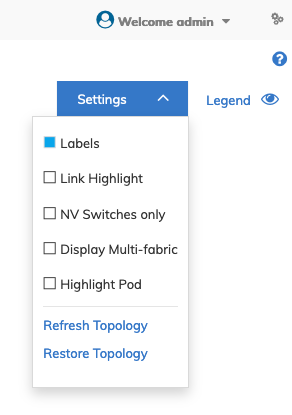
NetVisor UNUM Dashboard Settings Menu
Device names are toggled by checking Labels displaying or suppressing device names in the topology.
Link Highlight, PN Switches Only, and Display Multi-fabric are useful functions for displaying complex topology maps and are mutually exclusive in the Dashboard.
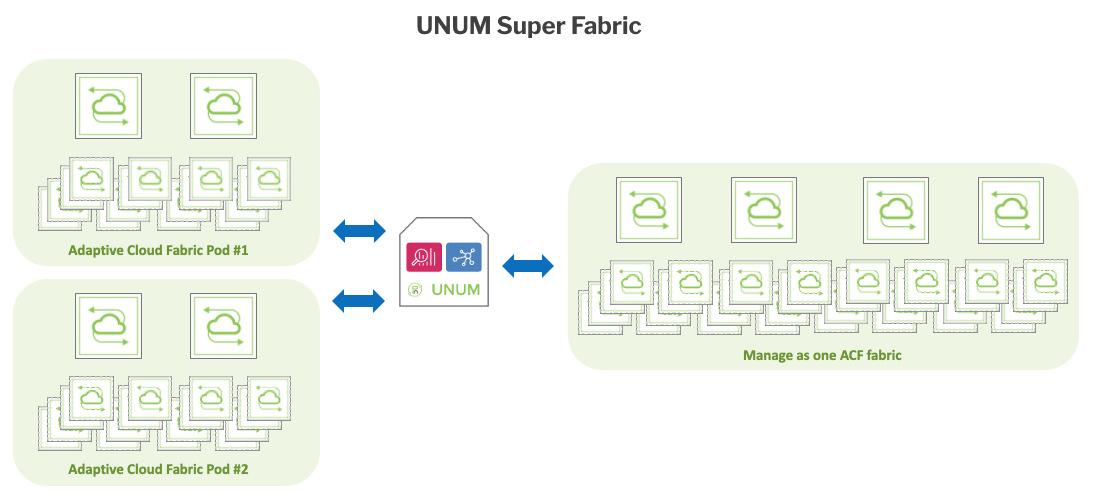
Highlight Pod displays Super Fabric details. A pod may contain up to a maximum of 32 switches. A Super Fabric expands that number to 140 switches using up to four pods.
Refresh Topology refreshes the topology map without changing the current layout.
Restore Topology resets the topology map to the NetVisor UNUM default layout and provides a convenient way to quickly reset the topology map.
Link Highlight
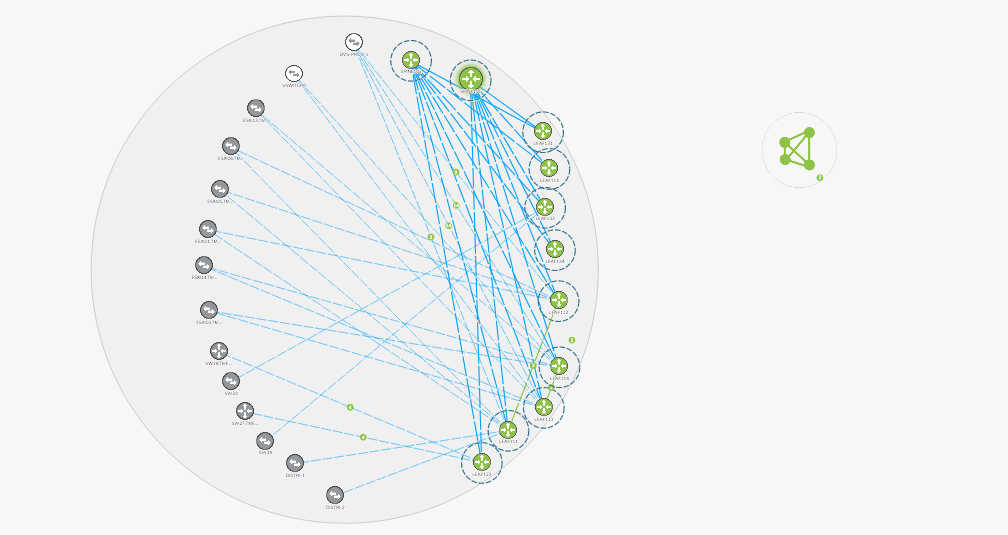
To view connection links between a specific device and other nodes select the applicable device from the Left-hand Navigation (LHN) pane and check Link Highlight. The display will update showing only those connections going to and from the selected device to the other nodes.
|
|
|
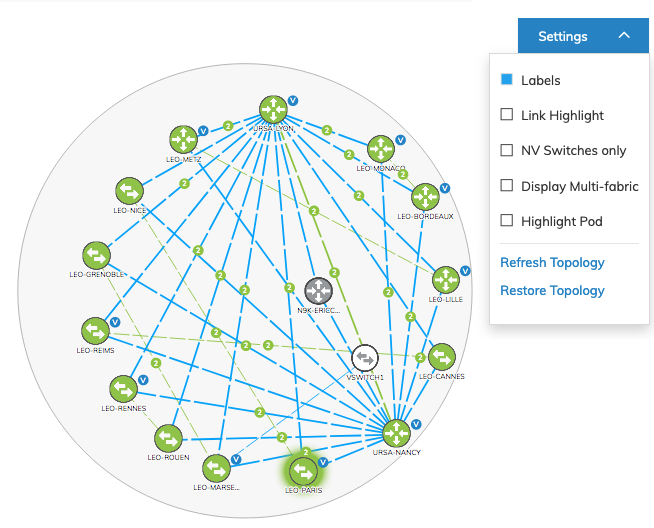
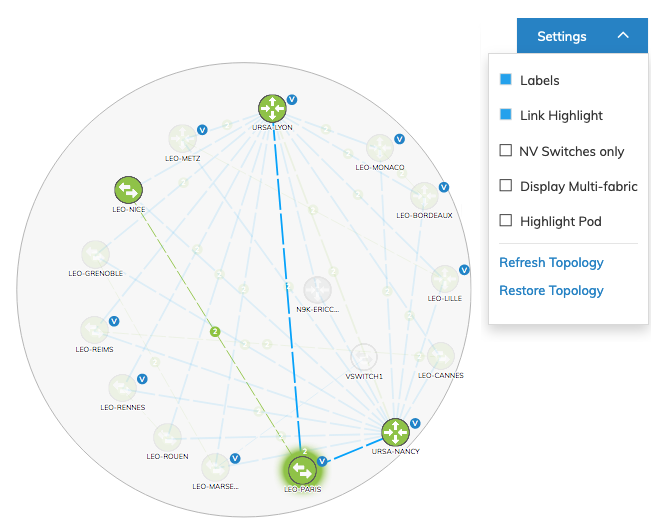
NetVisor UNUM - Topology Map Link Highlight Feature
Selecting the Fabric name from the LHN displays connection going to and from the seed switch or seed switches (in Web-HA mode) to other devices.
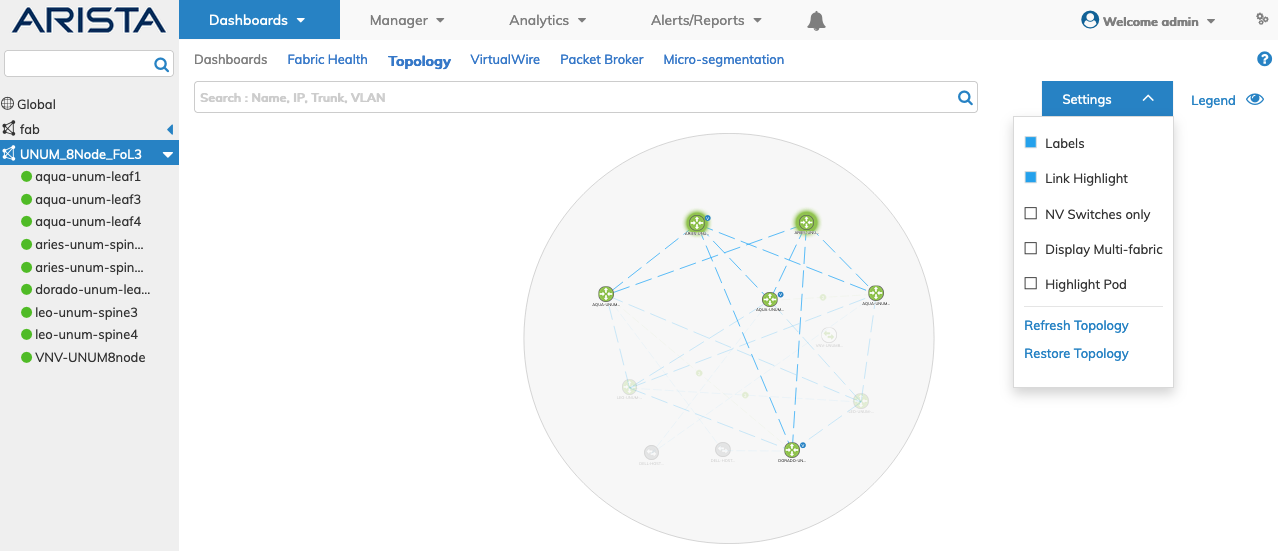
NetVisor UNUM - Topology Map Link Highlight Feature - Fabric and Seed Switches
PN Switches Only
To view only NetVisor switches select the applicable device from the left-hand navigation bar and check NV Switches Only. The display will update showing only NetVisor switches.
|
|
|
NetVisor UNUM Platform Global - Topology Map PN Switches Feature
Topology Map Multi-Fabric Support
To view multi-fabric topologies select Show → Display Multi-fabric and set the flag.
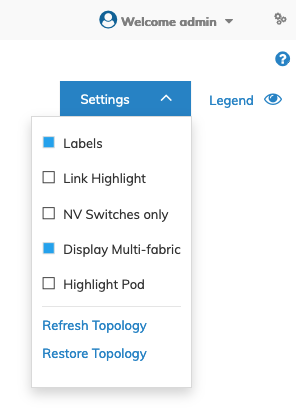
Multi-fabric - Display Multi-fabric Flag
For those Fabrics connected to other Fabrics the map will merge the Fabrics into a single display and show the inter-connected switches and routers on a merged map as illustrated below.
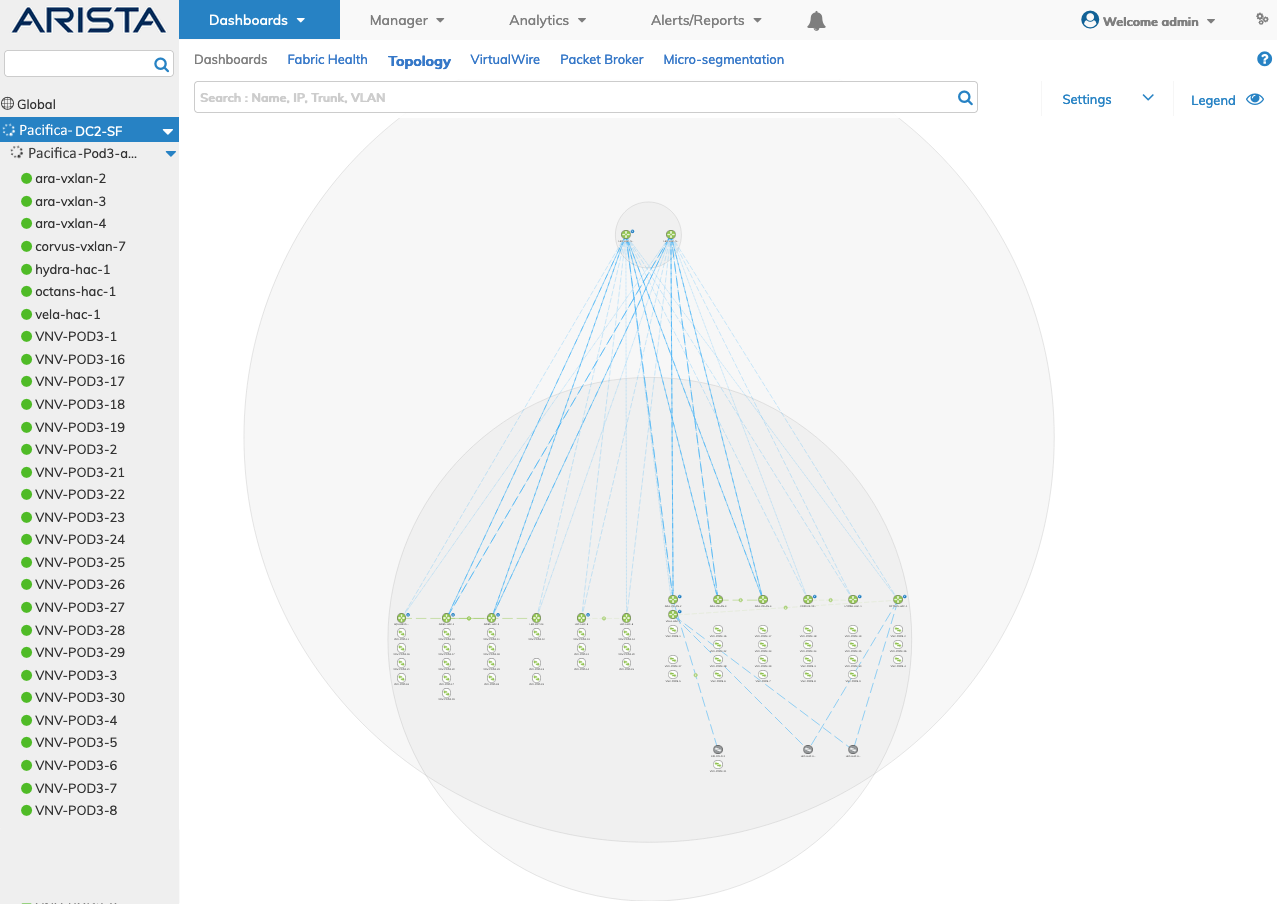
NetVisor UNUM Topology - Multi-Fabric Merged Fabric Map
Connections between devices are represented in the topology map as solid and dashed lines, thickness denoting bandwidth. The thicker the line, the higher the bandwidth.
While holding your "Command" or "CTRL" key on your keyboard clicking on a Fabric topology within the Multi-Fabric dashboard will collapse the topology map.
Repeating the sequence will restore the topology map.
You select multiple switches while holding your "Command" or "CTRL" key on your keyboard and create a "group" of switches and move them to a applicable location within the dashboard.
A blue dotted circle appears indicating the switch is selected.
Once all the applicable switches are selected you release the "Command" or "CTRL" key.
NetVisor UNUM Topology Map Multi-Fabric Select Switch Group Feature - Create Group
Now you move all the "grouped" switches to the applicable location within the dashboard.
NetVisor UNUM Platform Global - Topology Map Multi-Fabric Select Switch Group Feature - Move Group
Once the drag operation is complete, you click the "C" key to clear the selection.
NetVisor UNUM Platform Global - Topology Map Multi-Fabric Select Switch Group Feature - Clear Group
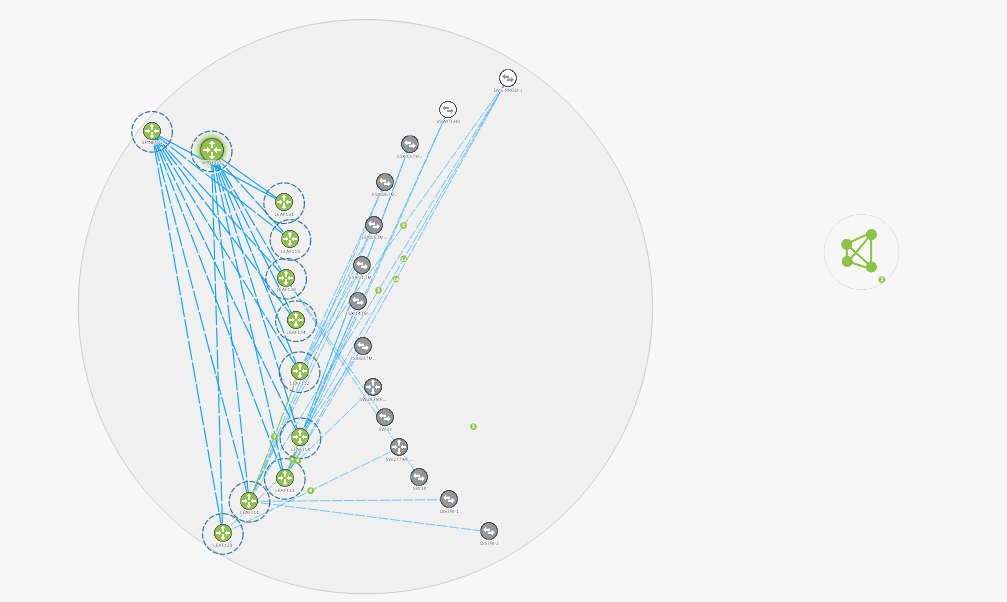
Highlight Pod
Highlight Pod displays Super Fabric details. A pod may contain up to a maximum of 32 switches. A Super Fabric expands that number to 140 switches using up to four pods.
NetVisor UNUM Platform Global - Highlight Pod Super Fabric Design
For more information about creating a Super Fabric, refer to the Super Fabric section of this documentation.
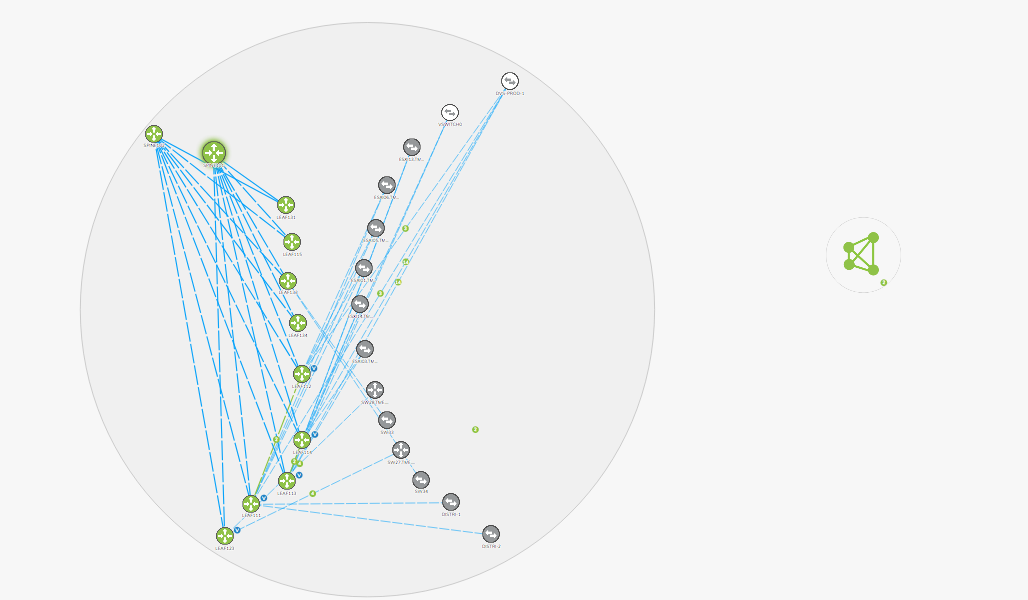
The topology map displays the Super Fabric in the larger circle, with the two pods shown as separate circles within.
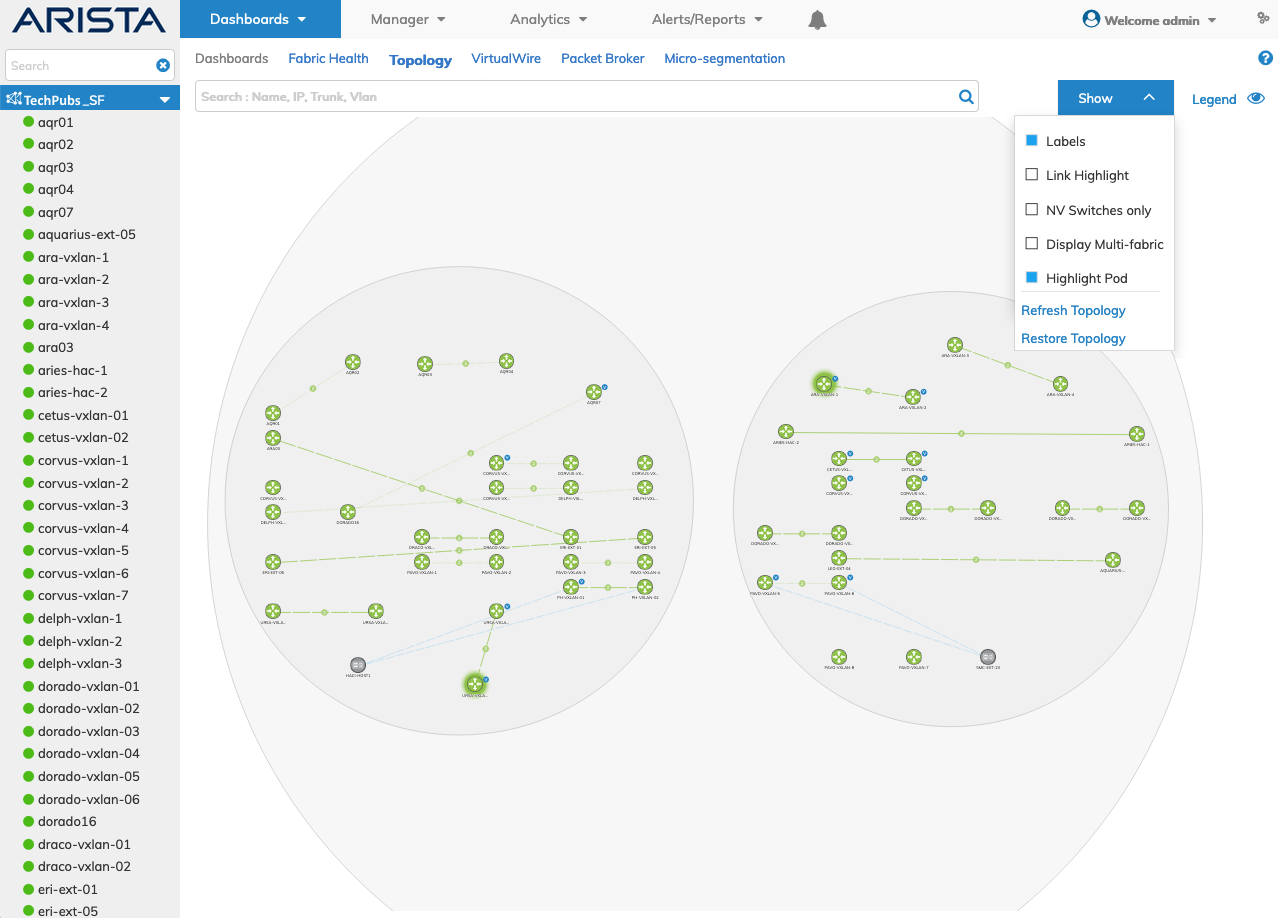
NetVisor UNUM Topology Map Highlight Pod Dashboard
Note: The following features are not supported in Super Fabrics: VirtualWire, Manage Services vLE, Mesh Ping, Manager Layer 3 Subnet, and Manager Layer 3 VRF. When attempting to access these features in a Super Fabric, you will see a "This feature is not supported for selected fabric." warning message.
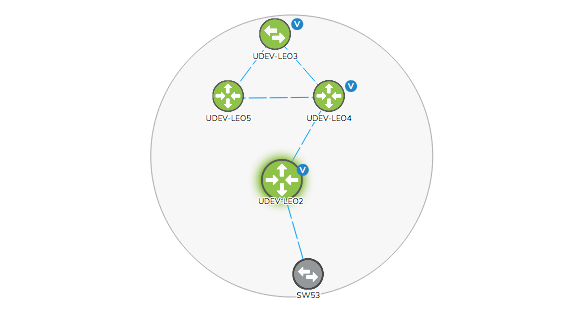
Topology Map Group Switches
You select multiple switches while holding your "Command" or "CTRL" key on your keyboard and create a "group" of switches and move them to a applicable location within the dashboard.
|
|
|
|
The original topology map as displayed in the dashboard. |
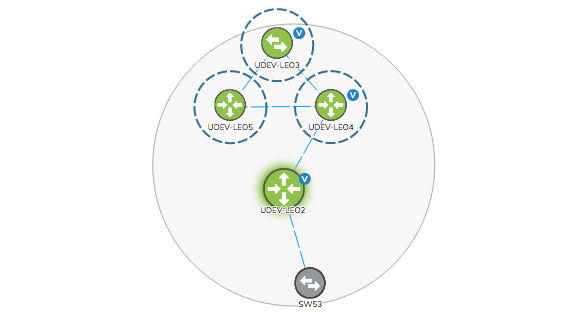
While holding your "Command" or "CTRL" key on your keyboard selected the applicable switches for the group. A blue dotted circle appears indicating the switch is selected. |
|
|
|
|
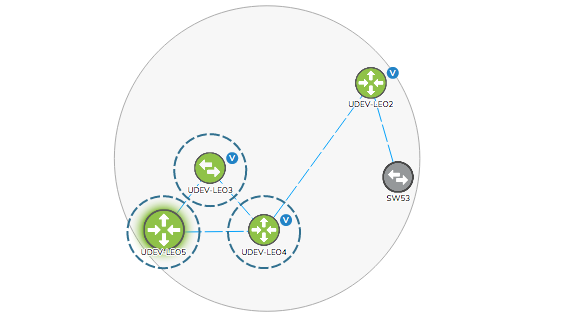
When all the applicable switches are selected you release the "Command" or "CTRL" key. Move the "grouped" switches to the applicable location within the dashboard. |
Once the drag operation is complete, you click the "C" key to clear the selection. |
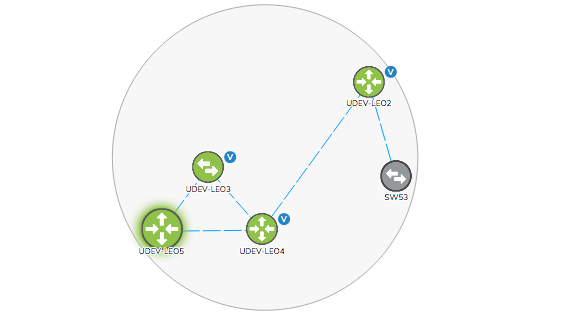
Topology Dashboard Group Switches
Refresh Topology
Refresh Topology refreshes the topology map without changing the current layout and centers it on the dashboard.
Topology Before Refresh
NetVisor UNUM Topology Map Refresh Topology Example - Before Refresh
Topology After Refresh
NetVisor UNUM Topology Map Refresh Topology Example - After Refresh
Restore Topology
Restore Topology resets the topology map to the default layout and provides a convenient way to reset the topology map. Any and all user display changes are lost.
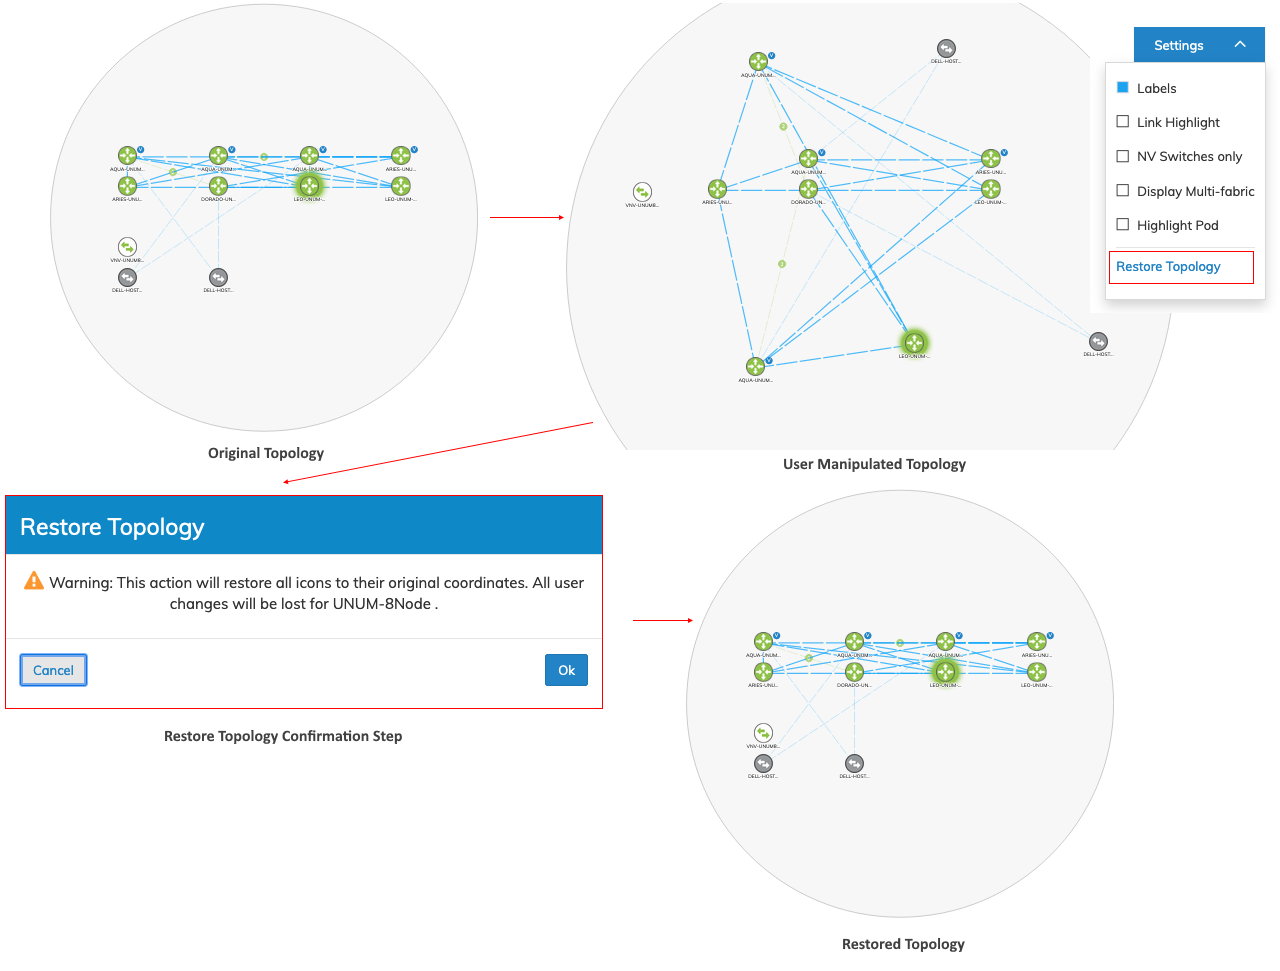
NetVisor UNUM Topology Map Restore Topology Example