
Dashboards
NetVisor UNUM Dashboards
There are features and functions used in Arista NetVisor UNUM and Insight Analytics that are common throughout the user interface (UI). Please refer to the Common Functions section for more information on the use of these functions and features.
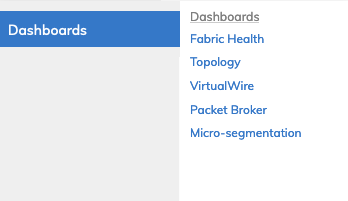
Selecting Dashboard displays a menu with Fabric Health, Topology, VirtualWire, Packet Broker, and Micro-segmentation.
NetVisor UNUM Dashboards Overview
NetVisor UNUM Dashboards Add Fabric
NetVisor UNUM Dashboards provides a convenient way to quickly access applications and configuration parameters used in NetVisor UNUM.
These include:
•Fabric Health – Fabric Health Widgets
•Topology – Topology Maps
•VirtualWire – VirtualWire Configuration
•Packet Broker – Packet Broker Configuration
•Micro-segmentation – Micro-segmentation
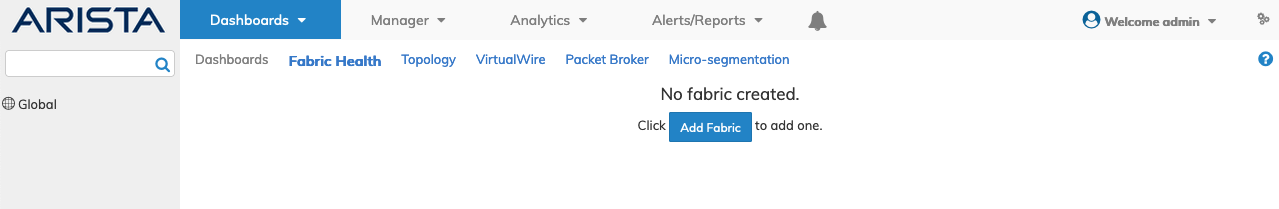
•Add Fabric – If no fabrics exist, use Add Fabric to create a fabric. For more information on creating fabrics, refer to details under the Manager section.
Left-Hand Navigation (LHN) Pane
If no fabrics exist, the default dashboard appears empty.
Using the LHN, right-click on Global, and three options appear:
•Add Fabric
•Backup Settings
•Create Group
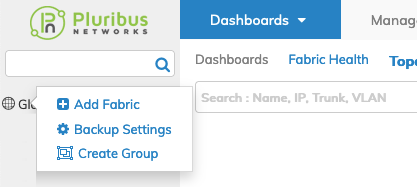
NetVisor UNUM Dashboard Global Left Hand Navigation Menu
To create a Fabric, right-click on Global and select + Add Fabric. Refer to details under the Manager Add Fabric section for more information on creating fabrics.
Note: Depending on the existing configuration state of your NetVisor UNUM instance, a topology map displays if you have previously configured a Fabric and Seed Switch.
Select Backup Settings and enter the applicable configuration values in the Update Backup Settings window. Refer to the Backup Settings section for more information on configuring and using Backup Settings.
Select Create Group to access the Groups feature, a management simplification tool that assists users in adding multiple Fabrics and Switches to a group or series of groups. The user then performs configurations on these groups instead of the individual Fabrics or switches. Refer to the Create Group section for more information on configuring and using Group settings.
In general, the LHN displays the following characteristics for the following dashboards:
Fabric Health
•When selecting a Super-Fabric on the LHN, it will display all the switches under the selected Super-Fabric.
•When selecting a Fabric under the Super-Fabric on the LHN, it will show only those switches under the selected Fabric, irrespective of the Fabric belonging to the Super-Fabric.
•When selecting a switch on the LHN, it will display the details for only the chosen switch.
Topology
•When selecting a Super-Fabric on the LHN, the Topology shows all the switches. To view the Pods on the Topology, select the "Highlight Pod" checkbox, which will enable the Pod circles. The Seed Switch of the respective pods/Fabric highlights. The details panel will list information of all the switches under the selected Super-Fabric.
•When selecting a Pod/Fabric under a Super-Fabric, the entire Super-Fabric to which the pod belongs is displayed, and only the chosen pod highlights on the Topology. The "Highlight Pod" checkbox has no effect in this case. The Seed Switch of the selected pods/Fabric also highlights. The details panel will list information of all the switches under the selected pod/Fabric.
•When selecting a switch on the LHN, the entire Super-Fabric to which the switch belongs displays, and only the switch highlights. When the "Highlight Pod" checkbox is selected, the Pod/Fabric to which that switch belongs highlights. The details panel will list information about the designated switch.
Manager
•When selecting a Super-Fabric on the LHN, it will display all the switches under the selected Super-Fabric.
•When selecting a Fabric under the Super-Fabric on the LHN, it will show only those switches under the selected Fabric, irrespective of the Fabric belonging to the Super-Fabric.
•When selecting a switch on the LHN, it will display the information for only the designated switch.
•
Analytics
•When selecting a Super-Fabric on the LHN, it will display all the switches under the selected Super-Fabric.
•When selecting a Fabric under the Super-Fabric on the LHN, it will show only those switches under the selected Fabric, irrespective of the Fabric belonging to the Super-Fabric.
•When selecting a switch on the LHN, it will display the information for only the designated switch.
Visual Color Indicators
Various widgets displayed throughout the NetVisor UNUM dashboard use color visual indicators Red, Yellow and Green.
Typically, the indicated percentage ranges are as follows:
|
Indicator |
|
|
|
|
|
Green |
= |
0% |
< |
70% |
|
Yellow |
>= |
70% |
< |
90% |
|
Red |
>= |
90% |
<= |
100% |
Certain widgets display error and network status and work in a similar manner.
These widgets display information about errors, congestion and drops using visual indicators in Red, Yellow, Green and Orange.
|
Indicator |
|
|
|
|
|
Green |
|
|
|
No errors and no congestion. |
|
Orange |
|
|
|
Error condition. |
|
Yellow |
|
|
|
Congestion only. |
|
Red |
|
|
|
Error and congestion. |
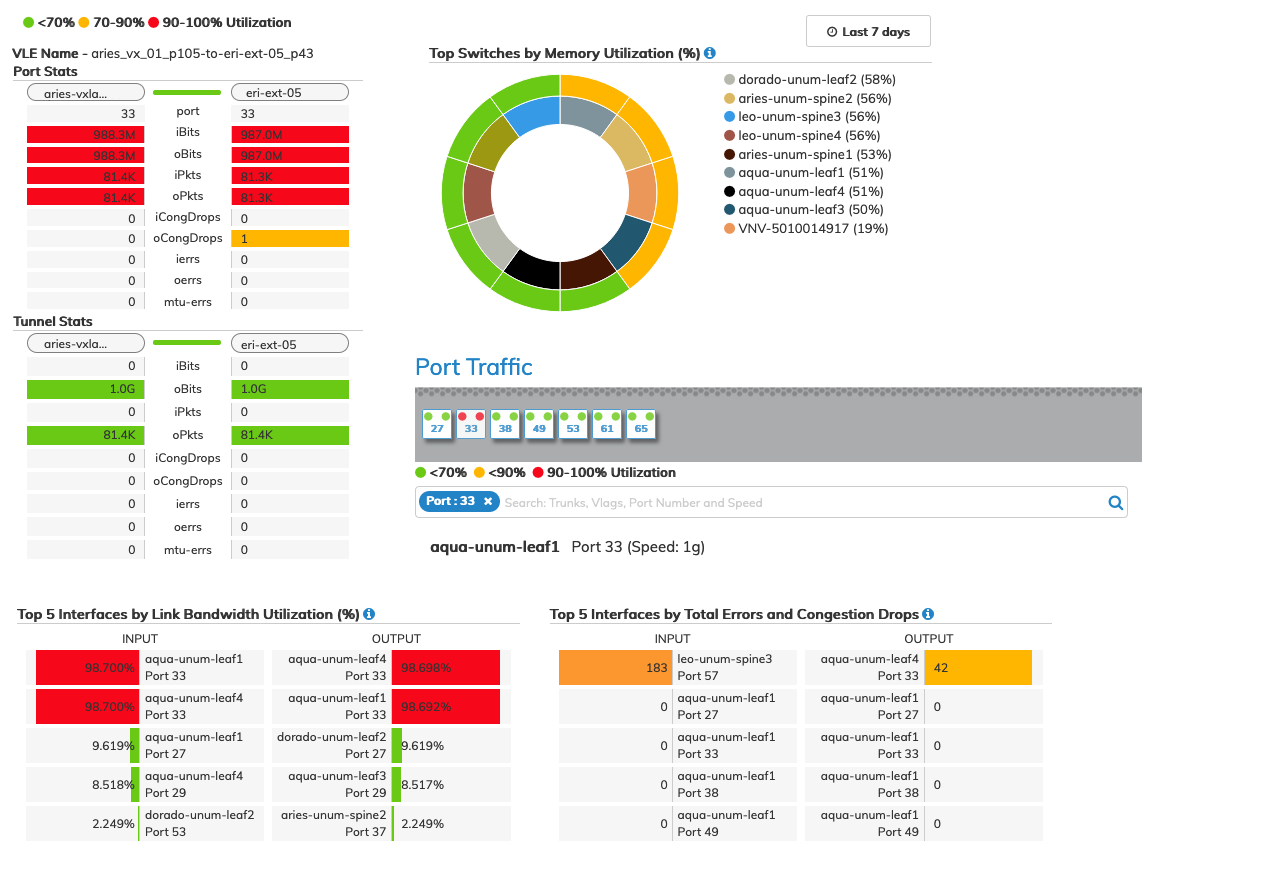
The following example illustrates how the various widgets and visual color indicators work together from the Fabric Health and VirtualWire dashboards:
Overlay and Fabric Dashboard Widgets
NetVisor UNUM Platform Software Version
Selecting Menu Bar → ![]() displays a drop-down list of configuration items and the Version number for the installed NetVisor UNUM Platform software.
displays a drop-down list of configuration items and the Version number for the installed NetVisor UNUM Platform software.
Details on configuring the NetVisor UNUM Platform are available here.
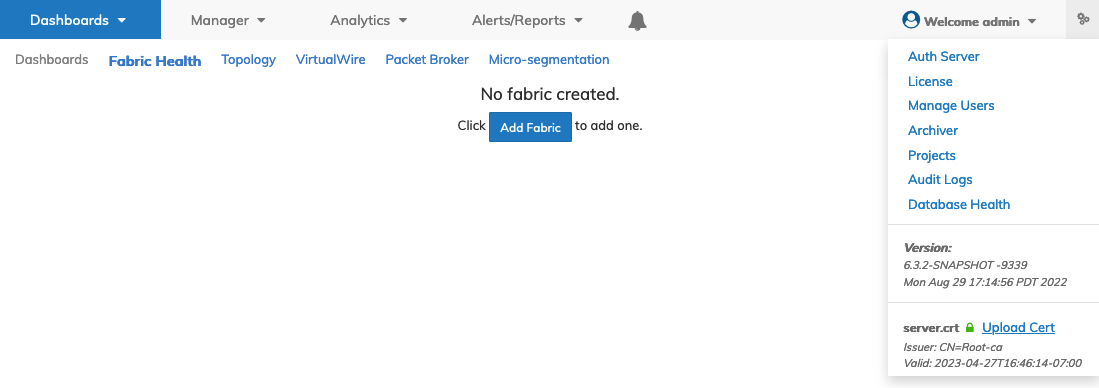
NetVisor UNUM Platform Software Version
By moving through the Manager, Analytics, Alerts/Reports tabs, applications and configuration features are displayed, and you are taken directly to a specific application by the selection you choose.
Note: Upon the initial login and after a new OVA install of NetVisor UNUM, you must activate specific licenses to use the various applications contained in NetVisor UNUM and a visual notification alarm may be presented on the dashboard indicating no licenses have been activated.
Instructions on activating licenses for NetVisor UNUM are detailed here in the User Guide.
Once the licenses are activated they will appear in the license section which is accessed using the bell icon on the top navigation bar.
License data is preserved across upgrades to NetVisor UNUM.