
VirtualWire
VirtualWire
Note: NetVisor UNUM does not currently support the VirtualWire Dashboard in a Super Fabric. NetVisor UNUM supports the Manage vLE function at a Pod level only. Select a Pod from the Left-Hand Navigation (LHN) pane.
VirtualWire or VW is a feature of NetVisor UNUM, which allows creating point-to-point and point-to-multi-point virtual links across a Fabric, simulating a patch-panel connection between the ports. This transparent connection enables customers to connect and test devices over the Fabric as if they were using a physical cable. This capability facilitates the dynamic reconfiguration of network topologies to avoid manual re-cabling of a lab environments, and to efficiently share expensive test tools such as traffic generators among multiple teams and multiple test-beds.
The connection between ports is known as a VirtualWire (formerly Virtual Link Extension or vLE). It is transparent to traffic - all Ethernet frames, all network control protocols, and CRC errors are transmitted and are completely isolated from the rest of the Fabric.
VirtualWire includes creation by DUT name for simpler management and a dashboard for easy monitoring and provisioning of all VirtualWires in the Fabric.
VirtualWire requires the VirtualWire license.
Some essential concepts of VirtualWire are:
VirtualWire Underlay Fabric: – The underlay fabric is the physical Fabric where the VirtualWire overlay service exists.
VirtualWire Overlay Network : This is a virtual overlay network, isolated from other overlay networks, used to carry the VirtualWire service.
VirtualWire Service: The VirtualWire connection that connects ports in an isolated overlay network through the Fabric. Formerly known as Virtual Link Extension or vLE
The VirtualWire Dashboard displays information about VirtualWire and DUTs across the fabric, including service status, port status, traffic stats and a visualization of the VirtualWires on a topology map with all the switches of the fabric.
The dashboard includes three searchable sub-dashboards as tabs:
Details – Provides a list of VirtualWires and details such as a switch, port, descriptions, and status.
Topologies – Provides a method to add, save, import, and re-use multiple topology configurations without having to re-enter values.
DUT Endpoints – Displays a searchable list using the user-generated device names to simplify the provisioning and monitoring of specific VirtualWires.
Caution: When creating an VirtualWire on a port with existing VLANs, any existing VLANs will be removed from the port. Removal of these ports can be traffic-impacting. Before proceeding, verify that the port does not have existing VLANs configured when creating an VirtualWire.
There are features and functions used in Arista NetVisor UNUM and Insight Analytics that are common throughout the user interface (UI). Please refer to the Common Functions section for more information on the use of these functions and features.
Note: Selecting Dashboards → VirtualWire displays information about a Fabric assuming a fabric was created and added. For more information about creating and adding a Fabric please refer to the ZTP - Zero Touch Provisioning section in this manual.
Depending on the configuration state of your NetVisor UNUM instance the Overlay may display VW mappings if a Fabric and Seed Switch have previously been configured.
In the case where VWs are not configured, the following dashboard is displayed. Fabric and switch names are displayed.
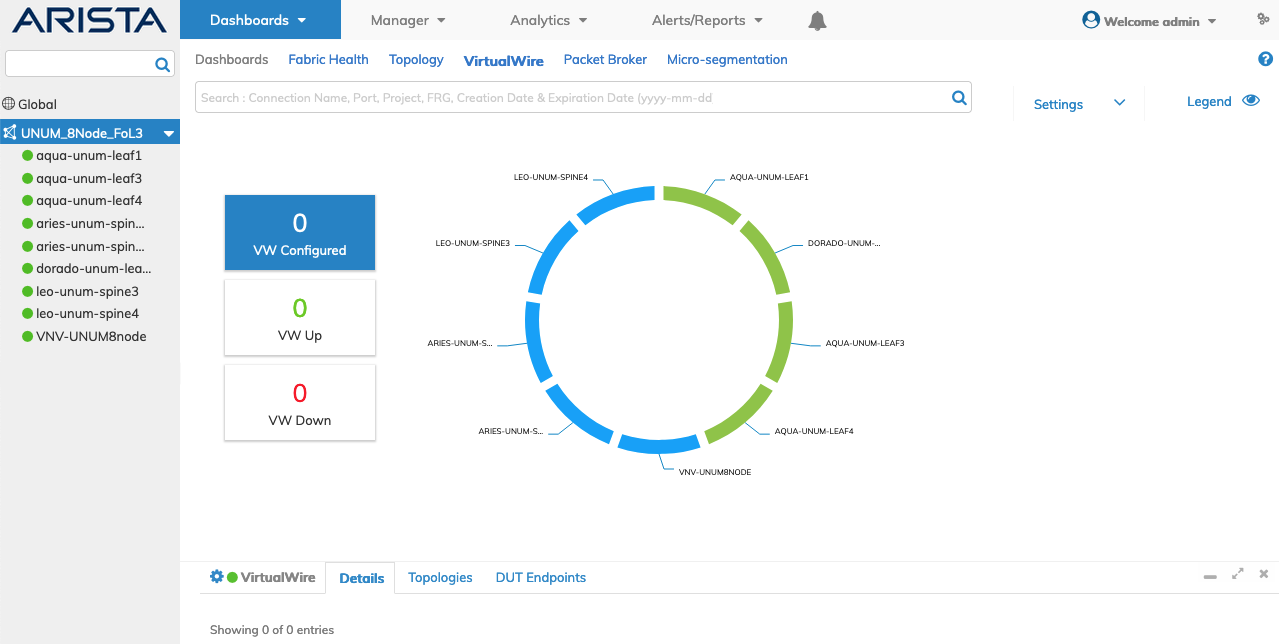
Dashboards VirtualWire - No VirtualWires Configured
Fabric and switch names are displayed along with data indicating the number of VW Configured, VW Up and VW Down.
Settings
In the VirtualWire dashboard, the Settings feature toggles the dashboard to display switches where tunnels exist or all switches in the Fabric.
The default dashboard is illustrated below on the left. In this example, four switches in the Fabric have established tunnels.
Selecting Display All-Switches updates the dashboard as shown on the right.
Note: It is only possible to create VirtualWire connections on switches where tunnels exist.
The dashboard example shown below shows a combination of switches (shown in blue) and clustered switches (shown in green). Typically, in lab automation, clustered switches are not used.
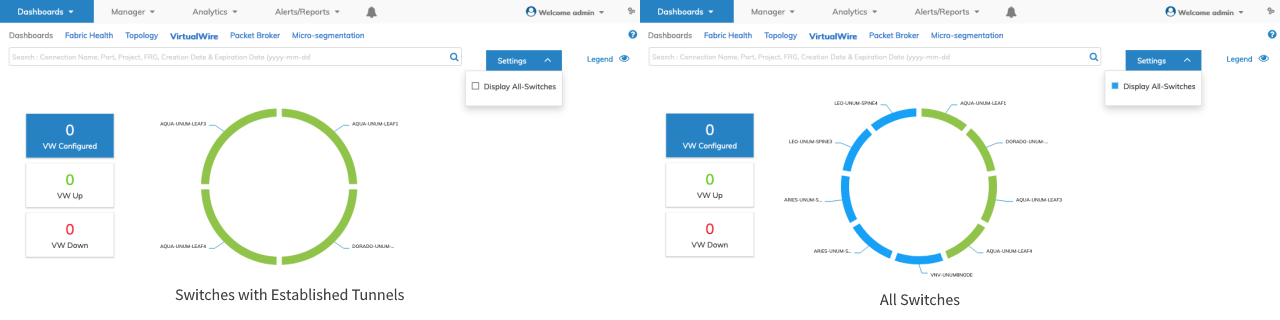
Dashboards VirtualWire - Settings
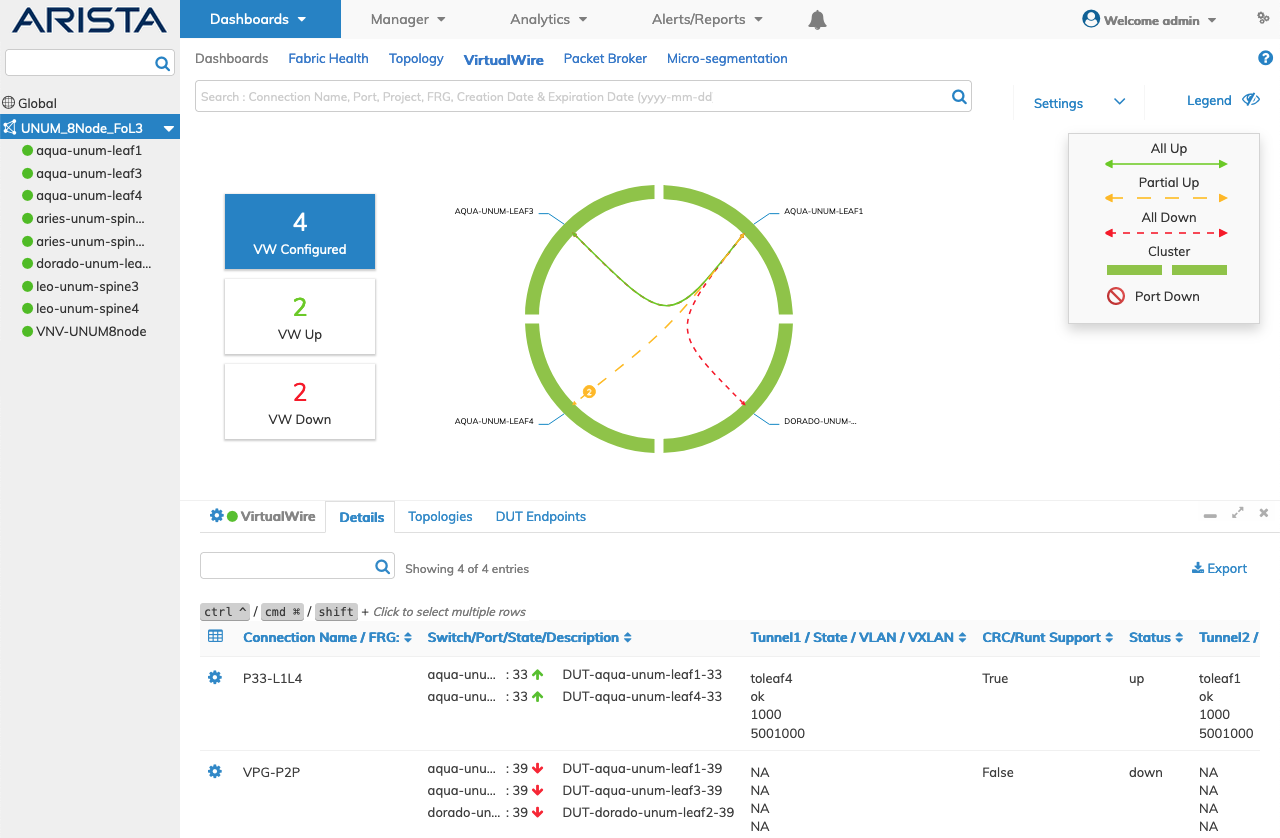
Legend
Click the ![]() icon to display the legend or
icon to display the legend or ![]() icon to hide the legend.
icon to hide the legend.
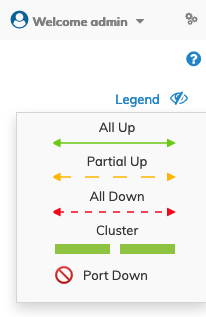
VirtualWire Legend
As detailed in the legend:
The colors Blue and Green denote if the switch is configured in a cluster configuration or configured as stand-alone.
•Solid Blue Wedges indicate a non-clustered switch.
•Solid Green Wedges indicate the switch is configured in a cluster configuration.
The inter-link connection colors denote VirtualWire status.
•Red Dashed Line – All Down - indicates all VWs are down.
•Green Solid Line – All Up - indicates all VWs are up.
•Yellow Dashed Line – Partial Up - indicates a mix of Up/Down connections.
•![]() – Port Down - indicates a Port Down condition.
– Port Down - indicates a Port Down condition.
Note: Screens depicted below are for illustrative purposes only and may contain simulated data.
In this example, when configured VWs exist, the following dashboard is displayed.
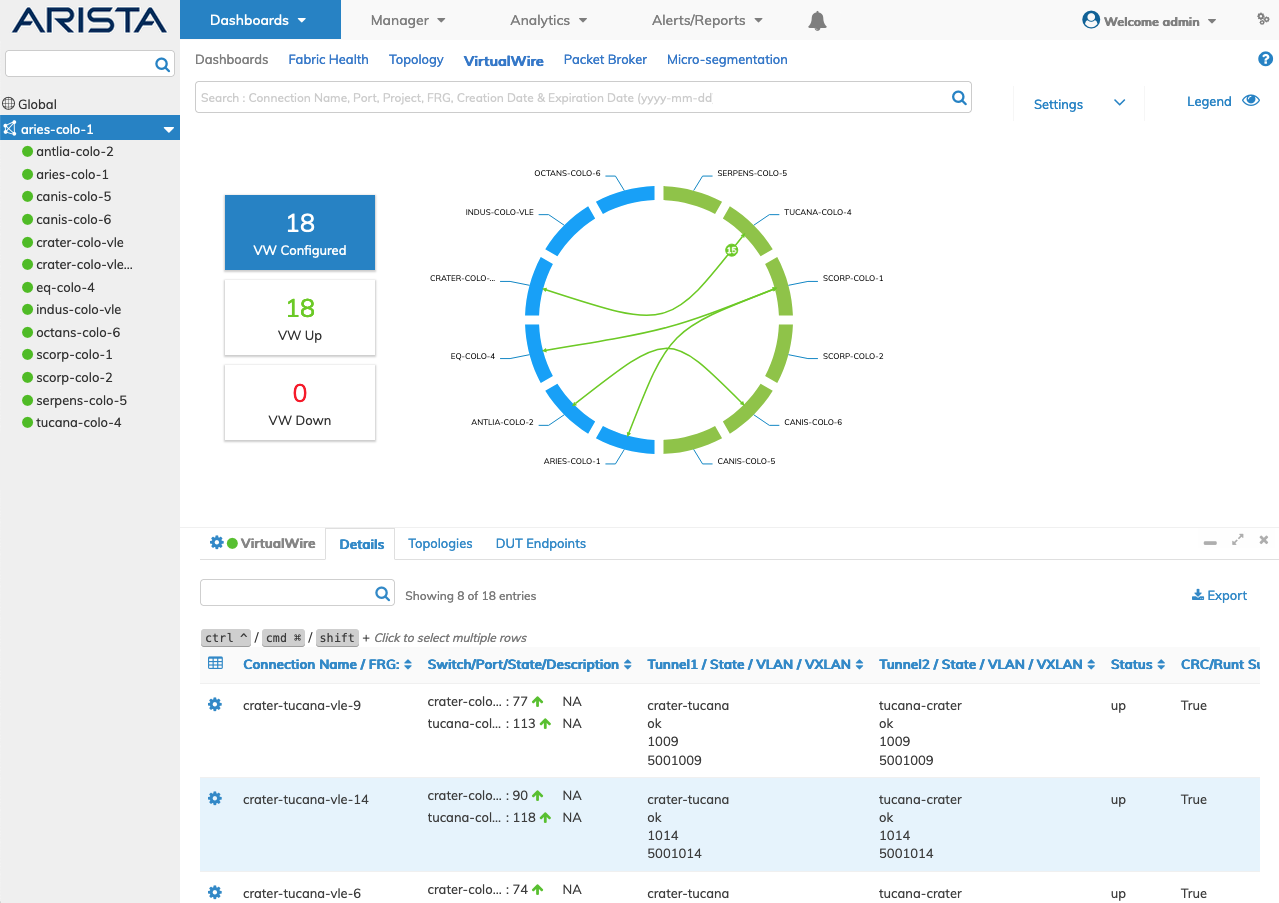
Dashboards VirtualWire - VW Configured
Dashboard Status Buttons
As shown in the example below, clicking on VW Configured, VW Up and VW Down updates the dashboard with specific information respectively (figures one, two and three).
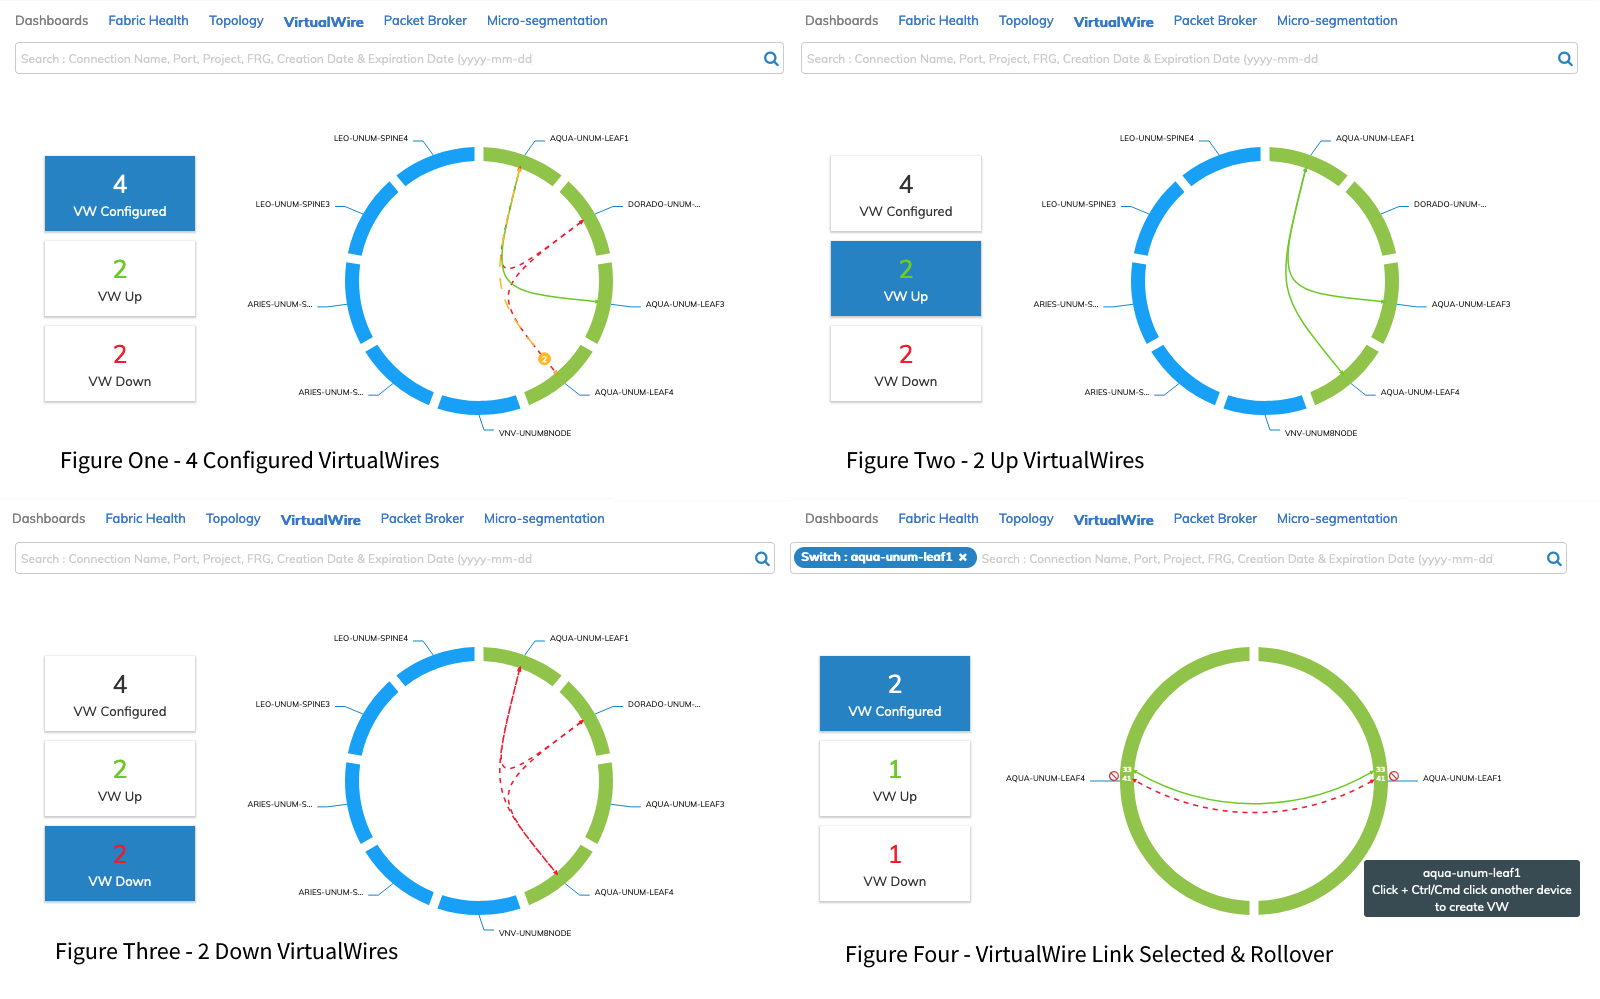
Dashboards VirtualWire - VW Dashboard Display Options
Dashboard Rollovers
Rolling over and clicking on individual links provides granular data on the Virtual Link Extension between the connected switches (figure four above).
Rolling over a VW connection provides additional details by VW name and Port information (figure four).
The Search bar populates with the search criteria as selected interactively (figure four).
Clicking on a link between two devices displays connection information as shown in the following illustration.
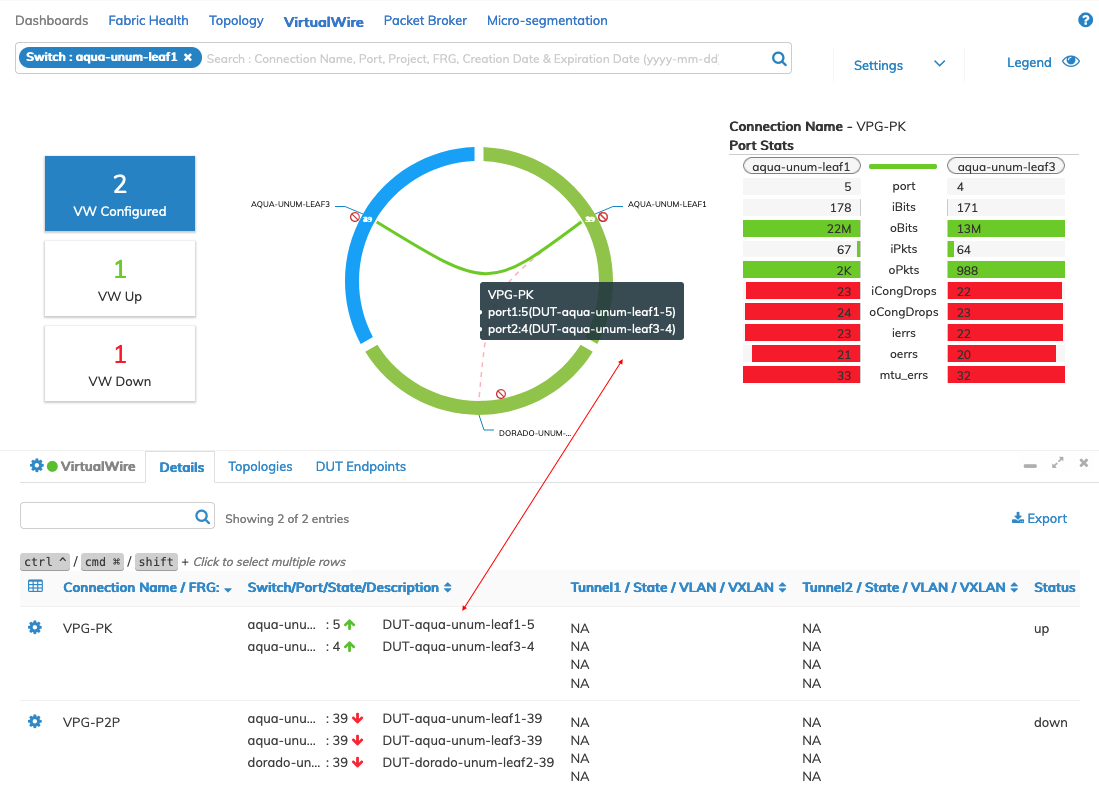
Dashboards VirtualWire - VW Dashboard Display Options - Connection Rollover
VirtualWire Details
The VirtualWire Details dashboard displays a list of VW connections by Connection Name /FRG along with Project, Switch/Port/State/Description, Tunnel1/State/VLAN/VXLAN, CRC/Runt Support, Status, Tunnel2/State/VLAN/VXLAN, Port Config State, Creation Date/Elapsed Time, Expiration Date, Traffic Filter, and Tracking.
By default, specific column tables are not displayed and may be activated as required using the ![]() icon.
icon.
Each Connection Name entry displays a status arrow indicating the state of the connection, Up or Down, shown as ![]() or
or ![]() .
.
Dashboards VirtualWire - Details Pane
The following dashboard example displays the Port Config State (override) when the P2P VirtualWire CRC/Runt Support is true.
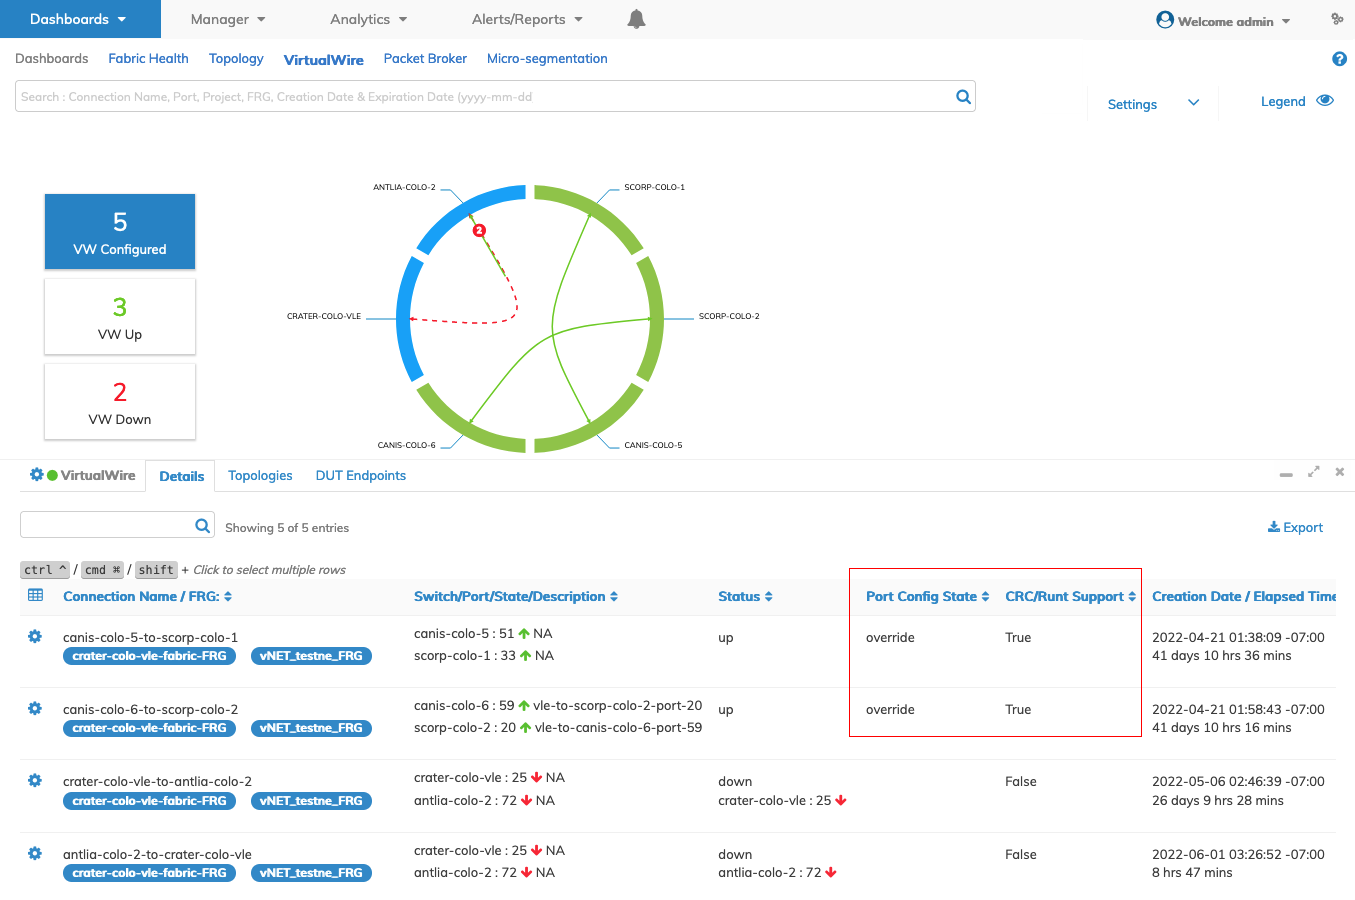
Dashboards VirtualWire - Details Pane - Port Config State
Down Port Scenario VW
For P2P connections and when Tracking is enabled, the Status column displays the down port information as shown in the following "all ports down" example.
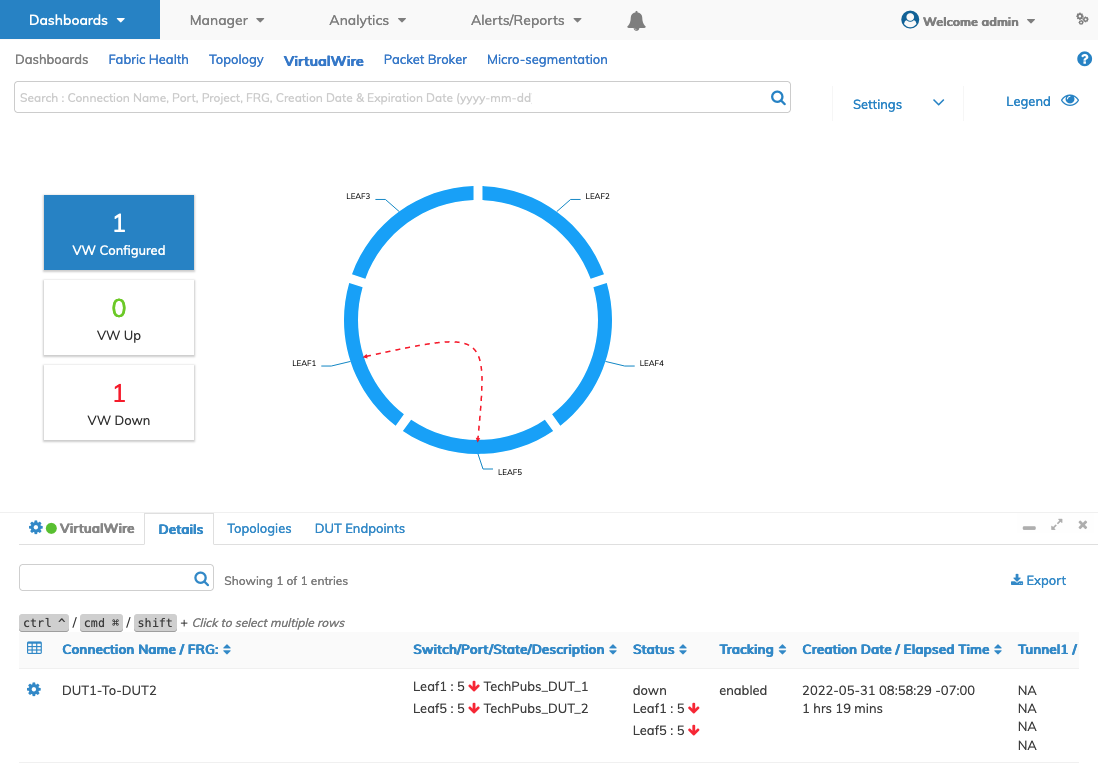
Dashboards VirtualWire - VW Dashboard Display - Status - Down Port P2P Example One
Down Port Scenario - Status Column Details
|
VirtualWire Type |
Point 1 / Port 1 |
Point 2 / Ports |
Tracking |
Status Column Details |
|
Point-To-Point |
Up |
Down |
Enabled |
Down Port Displayed |
|
Point-To-Point |
Up |
Down |
Disabled |
No Port Information Displayed |
|
Point-To-Point |
Up |
Up |
Enabled |
"Up" Displayed |
|
Point-To-Point |
Down |
Down |
Enabled |
Point 1 Port Displayed |
|
Point-To-Point |
Down |
Down |
Disabled |
No Port Information Displayed |
|
Point-To-Multi-Point |
Down |
Up |
Enabled |
Point 1 Port Displayed |
|
Point-To-Multi-Point |
Down |
Up |
Disabled |
No Port Information Displayed |
|
Point-To-Multi-Point |
Up |
Multiple Ports Down |
Enabled |
No Port Information Displayed |
|
Point-To-Multi-Point |
Up |
Multiple Ports Down |
Disabled |
No Port Information Displayed |
Dashboards VirtualWire - Down Port Scenario - Status Column Details
For P2P connections and when Tracking is enabled, the Status column displays the down port information as shown in the following "port up / port down" example.
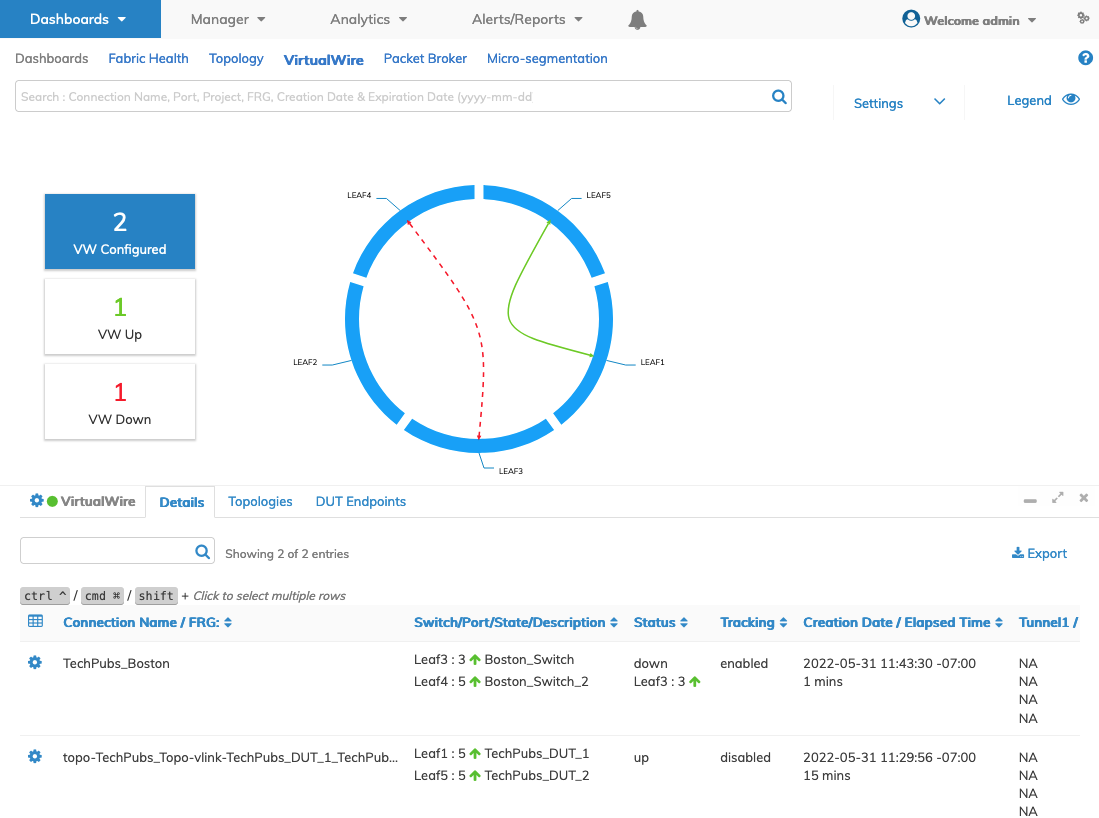
Dashboards VirtualWire - VW Dashboard Display - Status - Down Port P2P Example Two
Search
Search through complex fabrics and VirtualWire configurations using the Search feature.
Search by Connection Name, DUT, Port, Project, FRG, and, Creation Date and Expiration Date. Wild card searches are allowed.
Begin by entering your search criteria. A drop-down list appears listing all matching criteria.
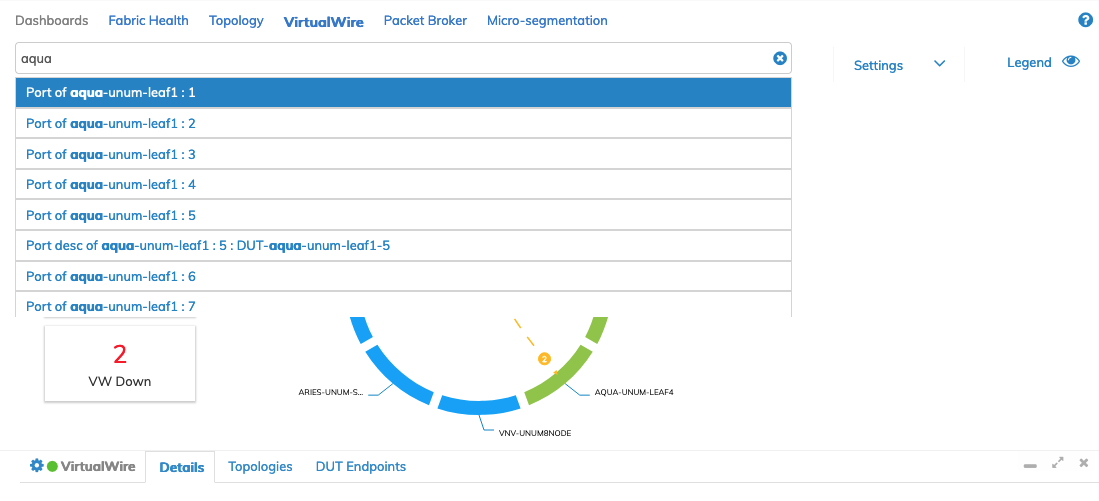
Dashboards VirtualWire - VW Search Drop-Down
Select the applicable entry and the dashboard updates with the information about the entered criteria. The switch highlights in blue in the search box.
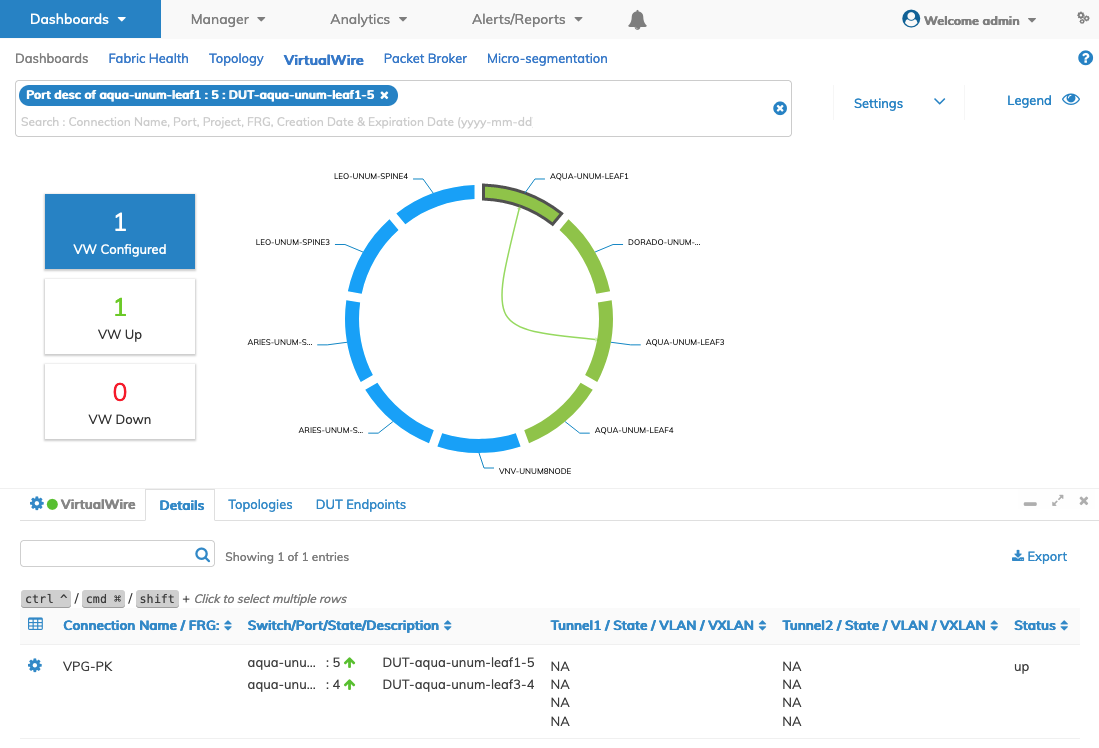
Dashboards VirtualWire - VW Search Results
Clicking on a VW connection line displays further information. Obtain more granular information about the connection by clicking again on a connection line. VW Name along with Port stats.
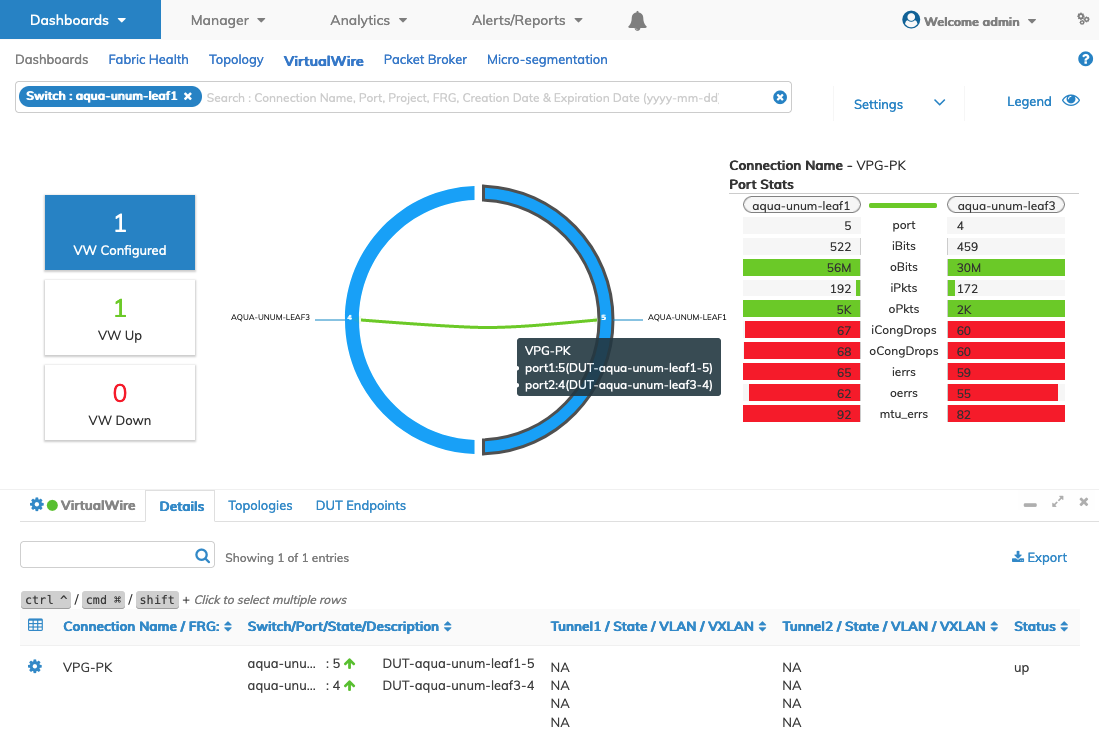
Dashboards VirtualWire - VW Connection Drill-down
The Port Stats widget displays bit and packet information along with visual indicators providing information about VW traffic in Red, Yellow and Green.
For Port Stats the indicated percentage is percentage of bandwidth or Link utilization percentage.
|
Indicator |
|
|
|
|
|
Green |
= |
0% |
< |
70% |
|
Yellow |
>= |
70% |
< |
90% |
|
Red |
>= |
90% |
<= |
100% |
Clicking on the Port Stats chart launches the Port Stats dashboard.
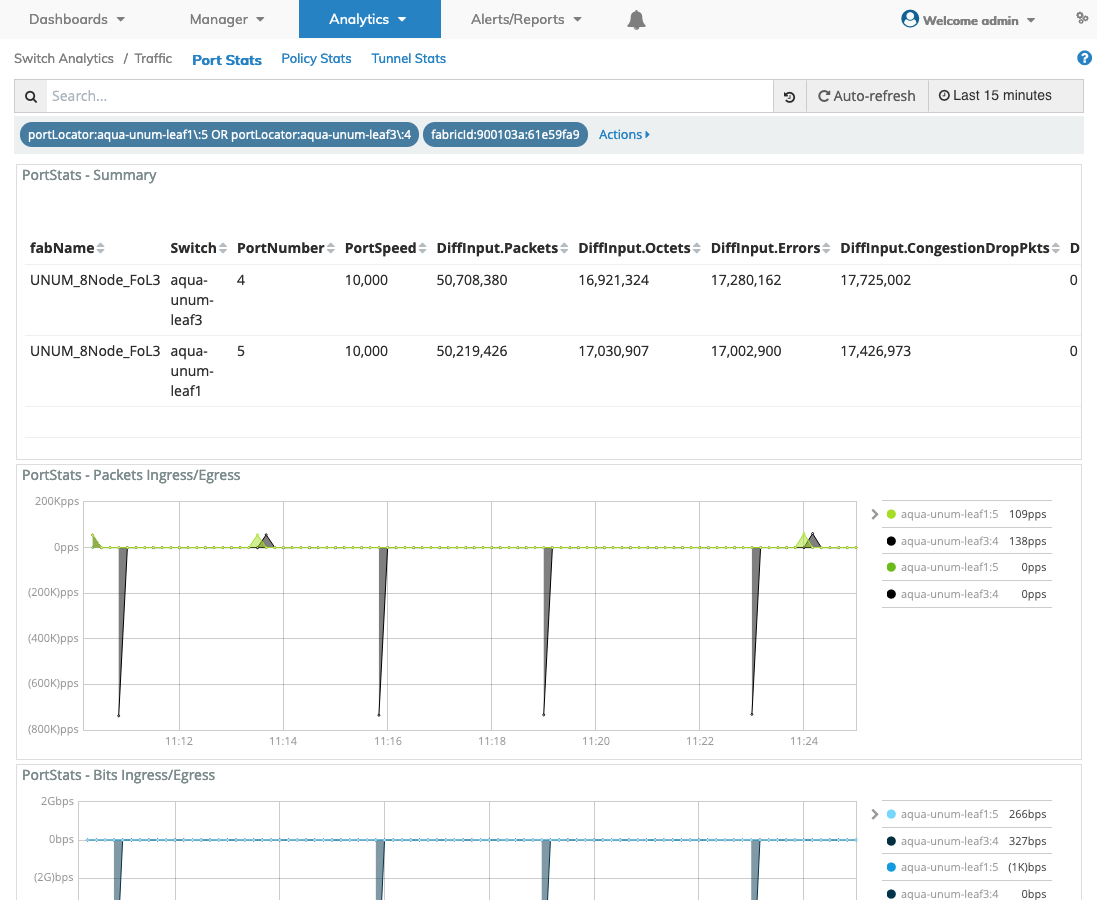
Dashboards VirtualWire - VW Connection Drill-down - Port Stats Dashboard
VirtualWire Menu Options•Add Topology (Add Topology Sub-Topic Section) •Add VirtualWire (Add VirtualWire Sub-Topic Section) •Add Device Under Test (Add Device Under Test Sub-Topic Section) |
|
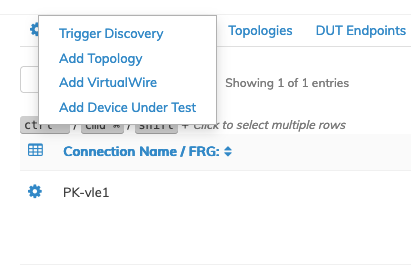
Dashboards VirtualWire Dashboard - Menu Items
|
Details Pane |
Topology Pane |
DUT Endpoints |
|
•Port Stats (Real-Time) |
•Edit (Modify Device Under Test) •Port Stats (Real-Time) |
|
|
|
|
|
Dashboards VirtualWire Dashboard - Menu Items Details, Topology, and DUT Endpoints
Trigger Device Discover
To manually trigger a VW discovery process use the Cog ![]() icon and select Trigger Discovery in the VirtualWire Menu Options panel to update the VW dashboard.
icon and select Trigger Discovery in the VirtualWire Menu Options panel to update the VW dashboard.
A "rotating icon" appears, indicating the discovery process is running.
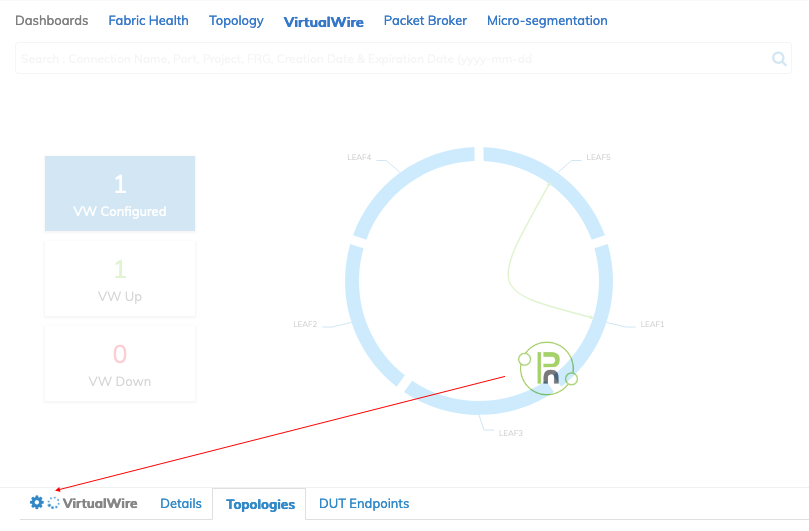
Dashboards VirtualWire - VW Discovering
Following the discovery process a pop-up indicator alerts to the discovered VirtualWires.
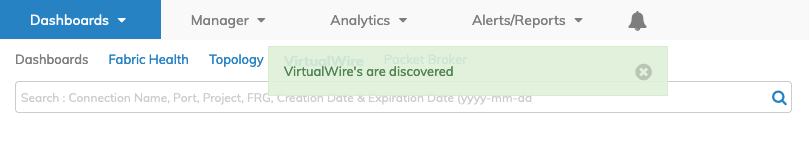
Dashboards VirtualWire - VW Discovered
Discovery Status Messages
Following a discovery process the Details dashboard displays a status message when rolling over the VirtualWire status icon.
Success Message
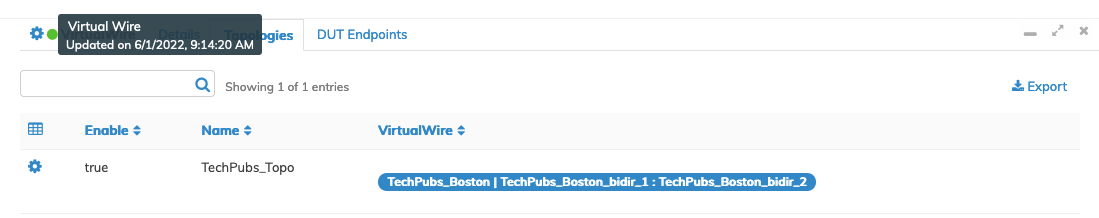
Dashboards VirtualWire - VW Discovered - Status Message - Success
Failure Message
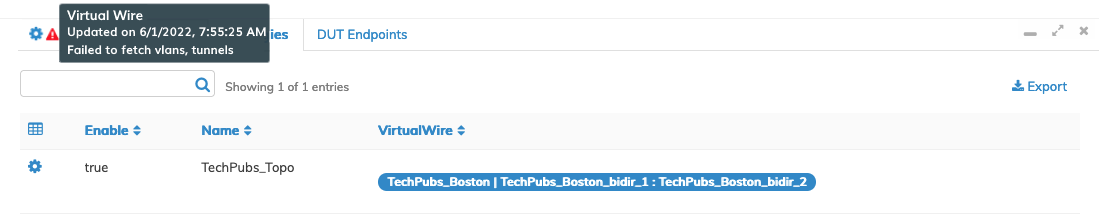
Dashboards VirtualWire - VW Discovered - Status Message - Failure Message
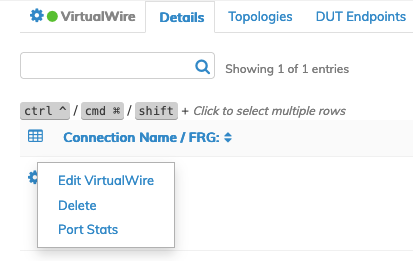
Edit VirtualWire
In the Details pane, choose a VirtualWire entry and use the Cog ![]() icon to select Edit VirtualWire.
icon to select Edit VirtualWire.
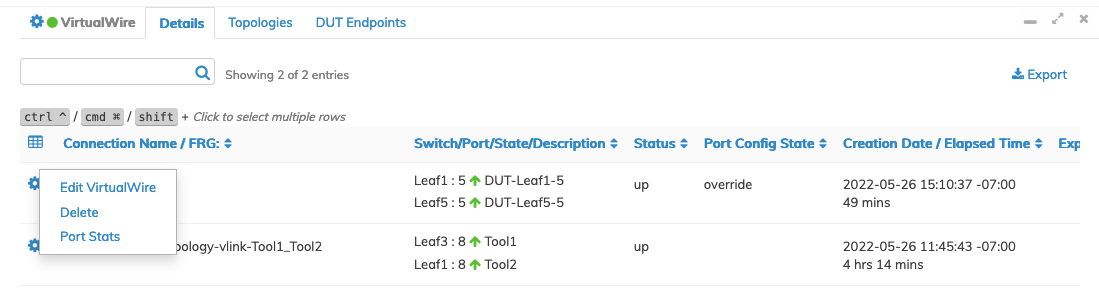
Dashboards VirtualWire - Edit VirtualWire
The current attributes and values are displayed along with the VirtualWire options.
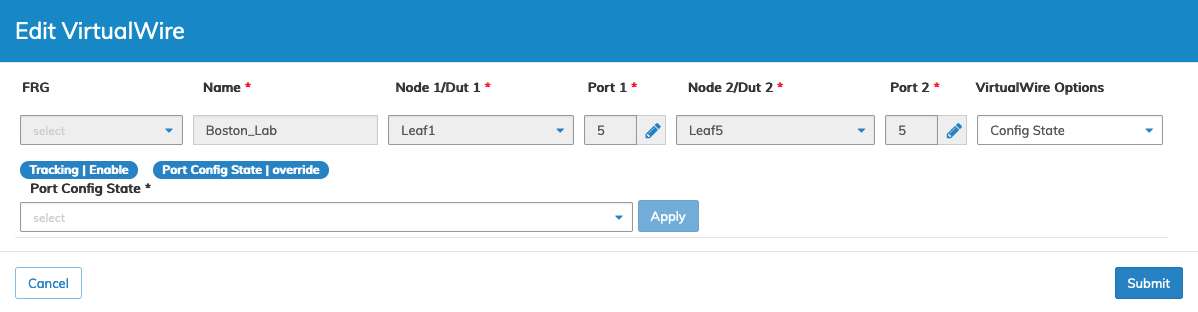
Dashboards VirtualWire - Edit VirtualWire Attributes and Values
Select a new VirtualWire Option from the VirtualWire Options drop-down list or select an updated value from the currently configured attribute. Port Config State and Tracking are the separately configured attributes in this example.
Note: By default, Tracking is enabled and can be disabled if required.
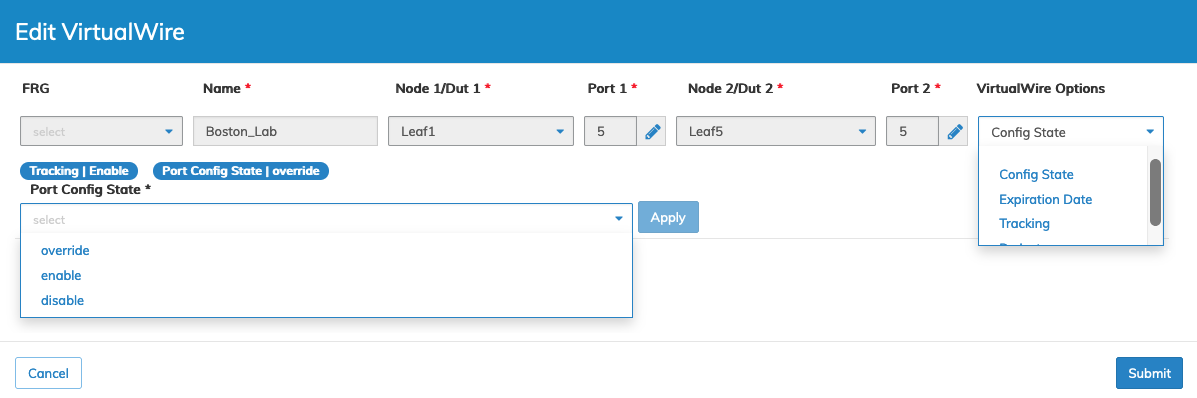
Dashboards VirtualWire - Edit VirtualWire Menu Options
Note: The image above is an example only for illustrative purposes. Select each menu separately to enter a new attribute or change a setting.
Add a new VirtualWire Option or make a change to a currently configured attribute. Click Apply to enter the change.
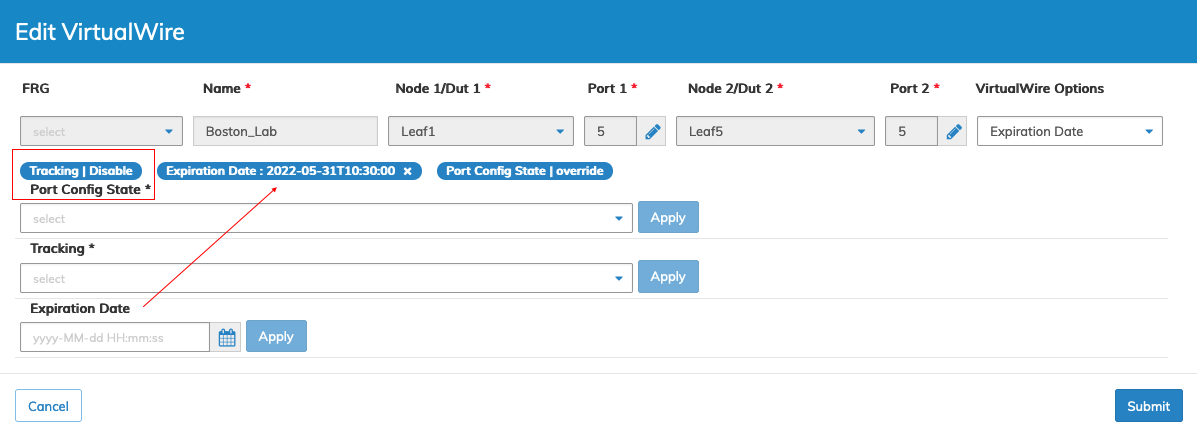
Dashboards VirtualWire - Edit VirtualWire - Changes
Click Submit to continue or Cancel to return to the previous screen without saving any changes.
The VirtualWire dashboard updates with the desired changes.
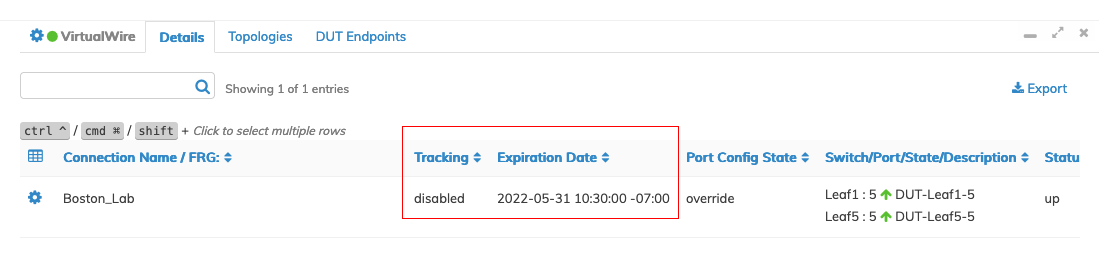
Dashboards VirtualWire - Edit VirtualWire - Dashboard Updates
Note: Only P2P and CRC/Runt VirtualWire connections support Link State Tracking. In P2MP and Monitor Port configurations, if one port goes down, not all associated ports will be brought down; some may stay up.
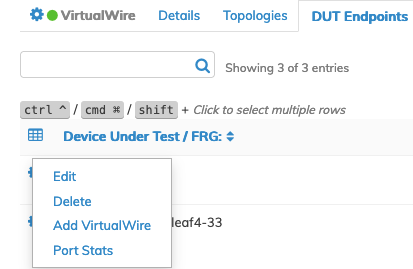
Edit - Modify Device Under Test
Select an entry from theVirtualWire DUT Endpoints pane using the Cog ![]() icon.
icon.
Dashboards VirtualWire - Modify Device Under Test - Settings
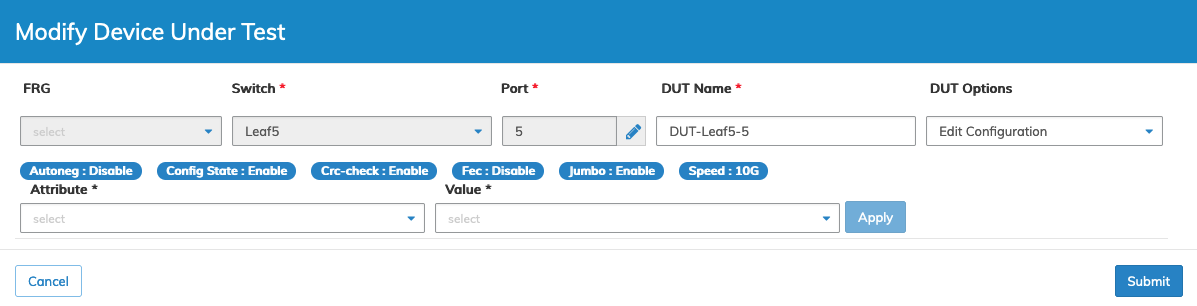
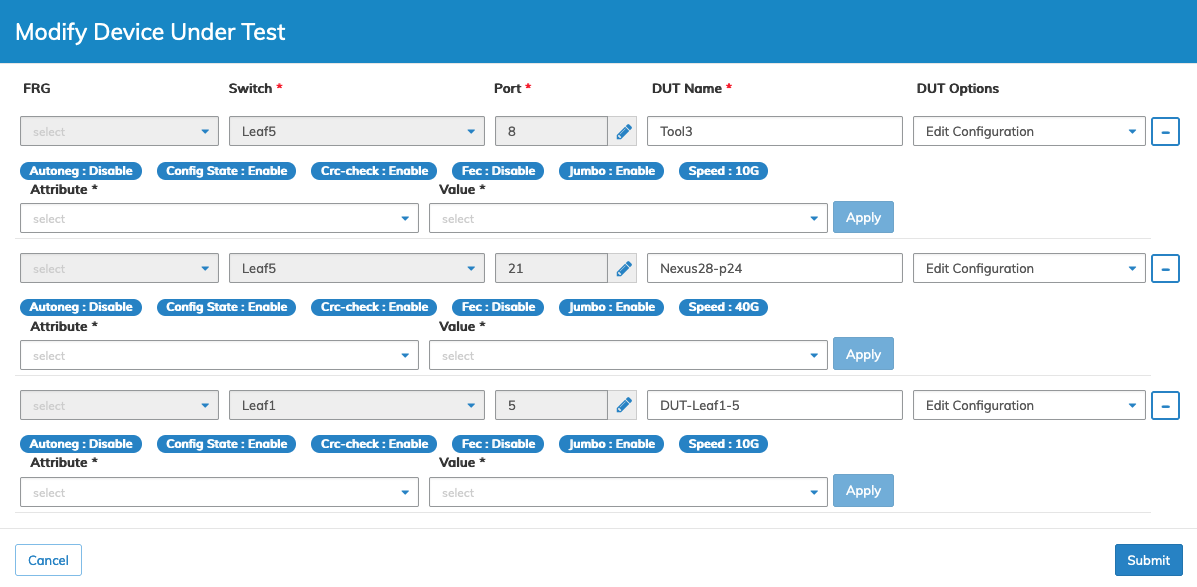
The Modify Device Under Test panel displays a list of VW configuration parameters.
Select a choice from DUT Options - Edit Configuration or Project - or an Attribute from the drop-down list and its associated Value.
Make changes as required. Click Apply to enter each change.
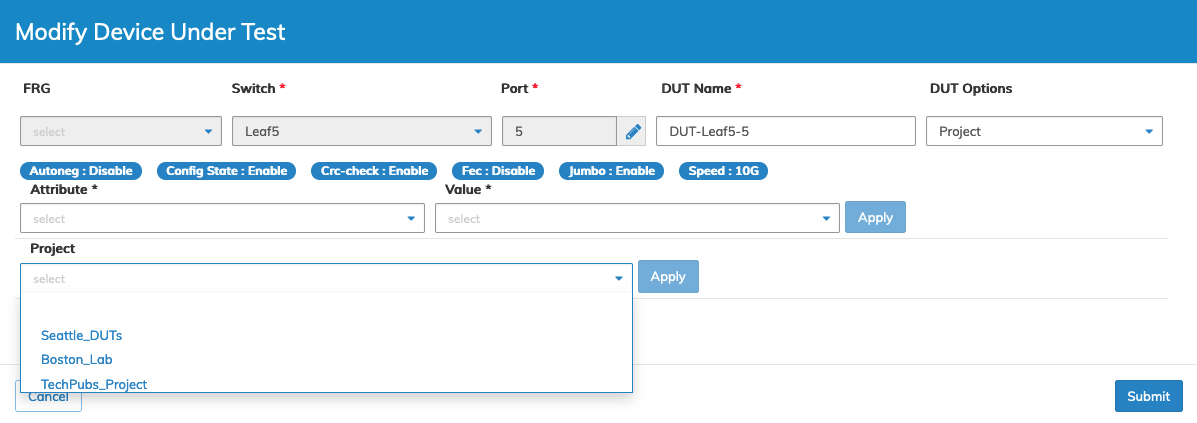
Dashboards VirtualWire - Modify Device Under Test - Project Example
Click Submit to continue or Cancel to return to the previous screen without saving any changes.
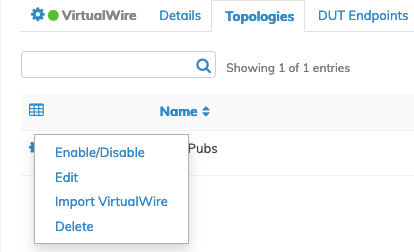
Delete
To delete a VW, Topology or a DUT Endpoint entry choose Delete by selecting the Cog ![]() icon in the respective pane.
icon in the respective pane.
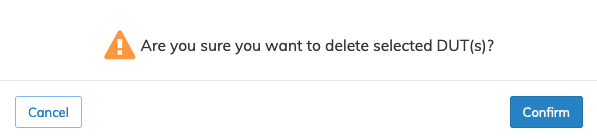
A confirmation message requires an acknowledgment to continue deletion.
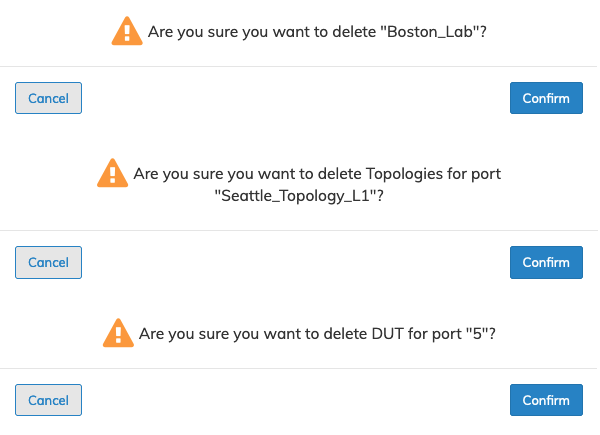
Dashboards VirtualWire VW Delete Entry Examples
Click Confirm to continue or Cancel to return to the previous screen without making any changes.
Bulk Edit - Bulk Delete
Using the VirtualWire Details pane, select each VW by holding CTRL / Command and click on a row or multiple rows to highlight the VW entries as illustrated in the following examples.
The dashboard displays the selected switches, the number of rows chosen, and the total number of entries.
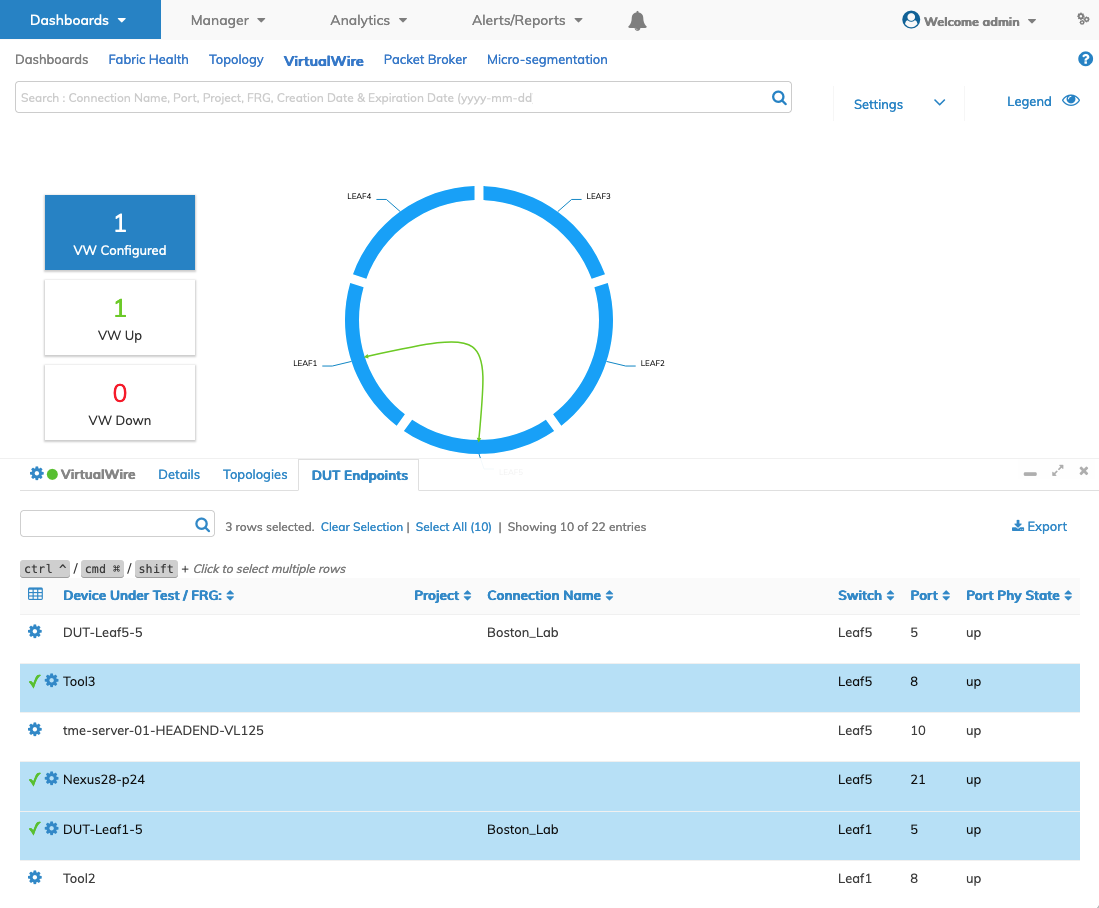
Dashboards VirtualWire VW Bulk Select
Right-click and select either Edit or Delete to begin the process.
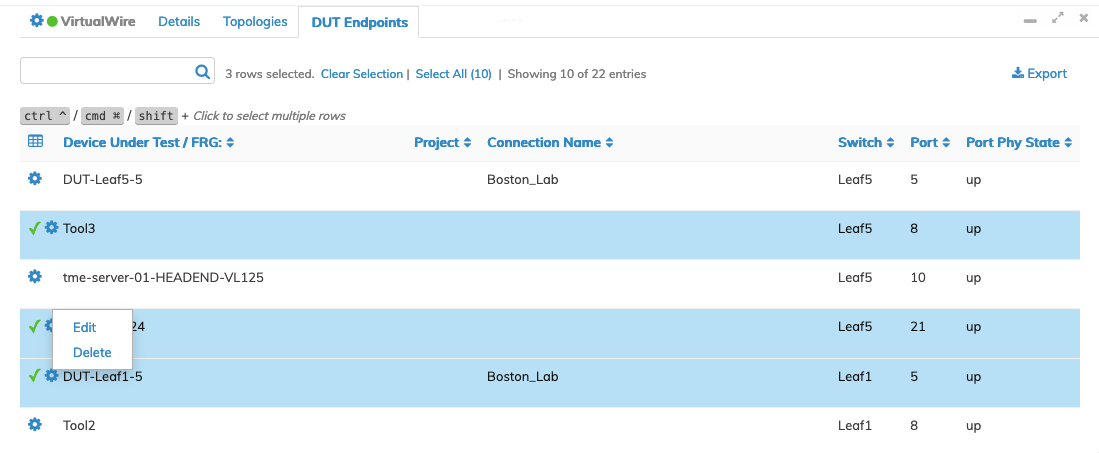
Dashboards VirtualWire VW Bulk Delete - Bulk Edit
Use the Clear Selection or Select All options, as required.
Bulk Deletion
Dashboards VirtualWire VW Bulk Delete - Confirm Delete
Confirm the deletion, click OK to continue or Cancel to return to the previous screen without making any changes.
Bulk Edit
Dashboards VirtualWire VW Bulk Edit s
Make the required changes and click Submit to continue or Cancel to return to the previous screen without making any changes.
The dashboard updates.
Port Stats (Real Time)
The Port Stats feature provides a real-time view via an SSH login shell on the associated switch to visualize port traffic.
To start the real-time view select Port Stats via the Cog ![]() icon.
icon.
Enter the switch login credentials.
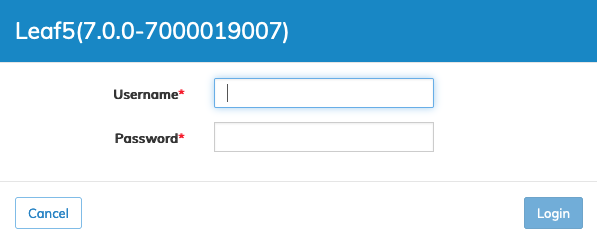
Dashboards VirtualWire VW Port Stats Login
Once the credentials are verified SSH windows open providing real-time data from the selected switch.
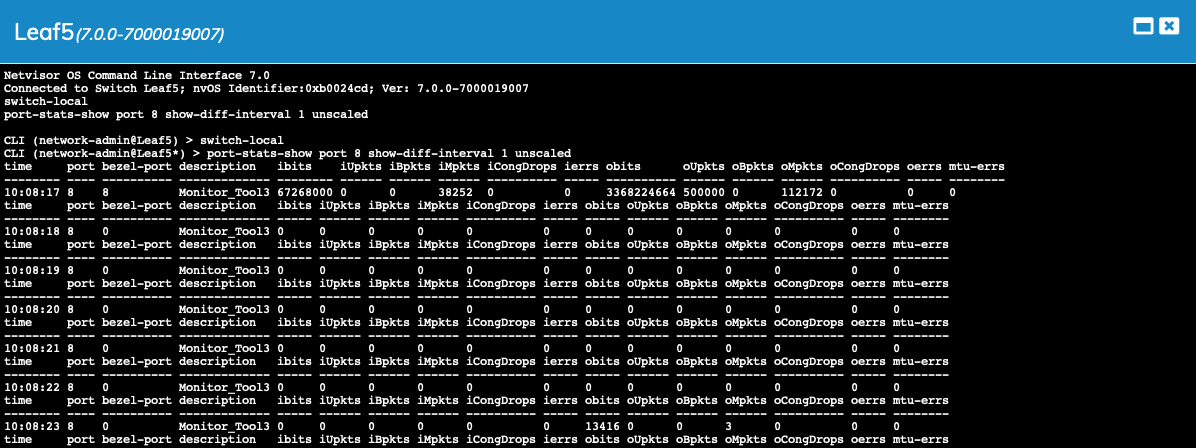
Dashboards VirtualWire VW Port Stats Real-Time Data
The Port Stats SSH session operates like a regular SSH terminal session. You can run other commands via the SSH session. To stop the existing data collection, use CTRL + C or Command + C to stop the pre-set running command. You can maximize, restore, close, or drag the SSH session windows independently.
Expiration Date
Adds a timer to the VirtualWire, which upon expiration, will automatically delete the VirtualWire and free up the resources.
Select Expiration Date from the VirtualWire Options menu to add an expiration date.
Enter the Expiration Date and click Apply.
The expiration date provides Year, Month, Day, and Time by Hour granularity.
The expiration appears in the Expiration Date window. Click Apply to enter the new expiration date value.
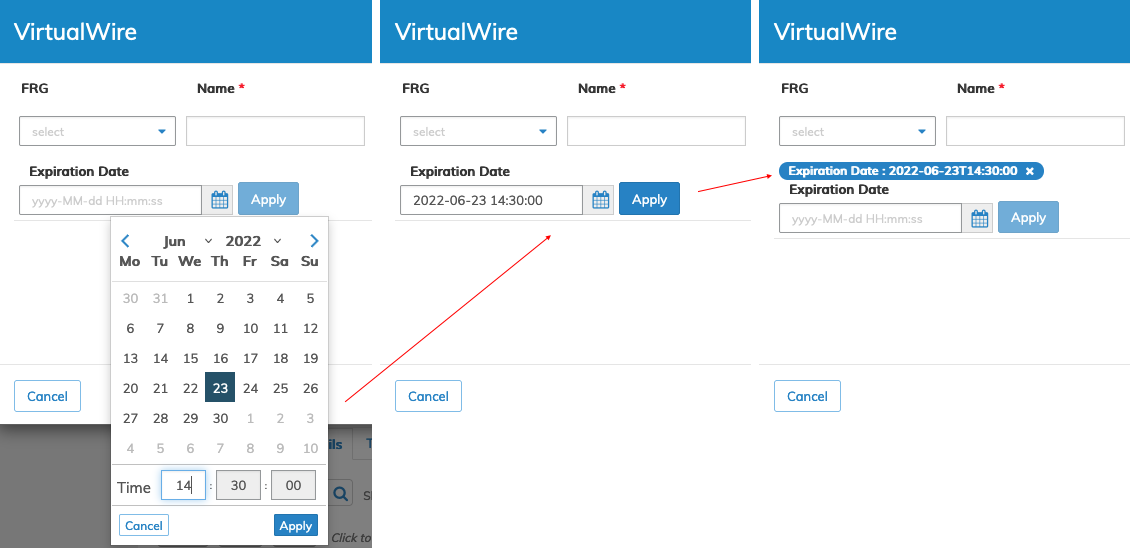
Edit VirtualWire - Device Under Test - Expiration Date
Click Submit to continue.
The Details dashboard displays the expiration date.
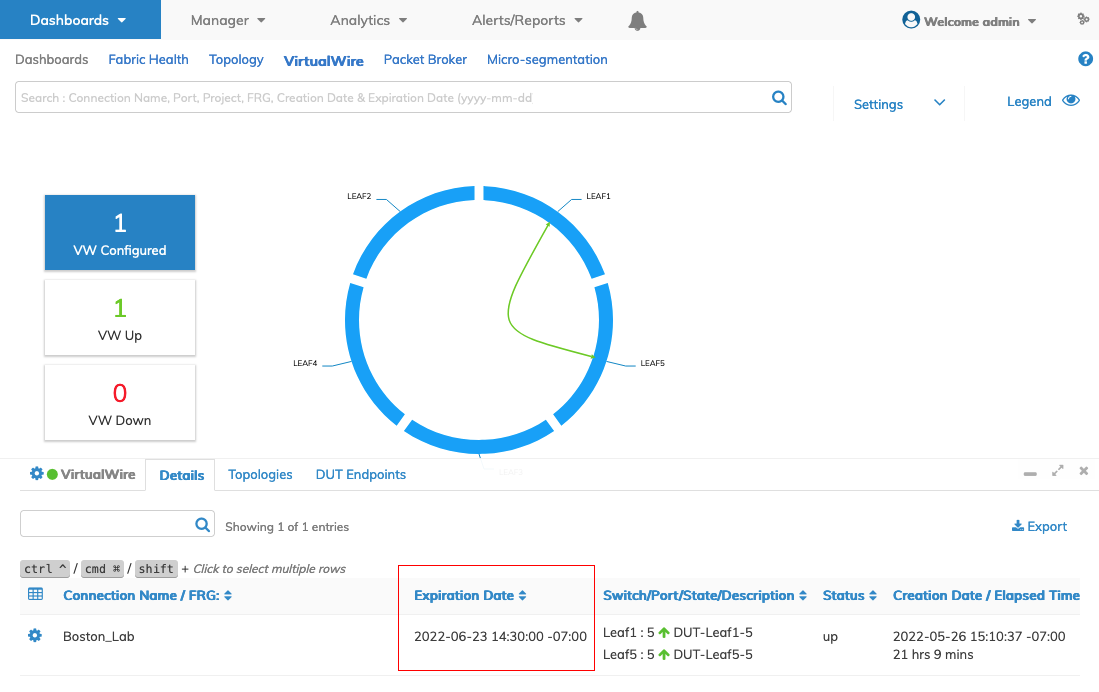
Edit VirtualWire - Device Under Test - Expiration Date - Details Dashboard
VirtualWire Details by Switch
Select a switch and the VW dashboard displays VW information for the selected switch. The topology updates to display the connections and the associated switches.
The switch VW dashboard operates similarly to the fabric-wide dashboards described above.
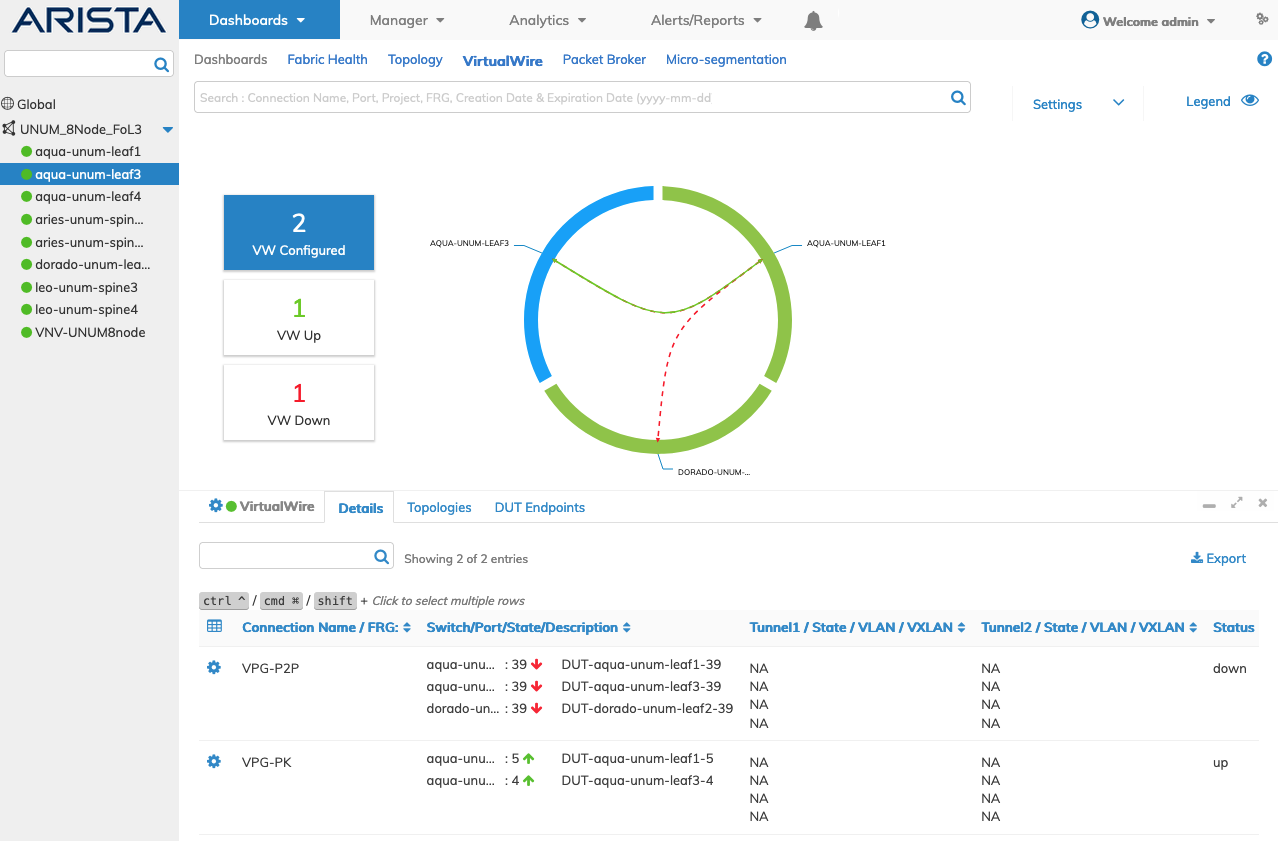
Dashboards VirtualWire Individual Switch
VirtualWire Details by Switch - Examples
Selecting individual switches updates the VirtualWire dashboard to display the connections and the associated switches.
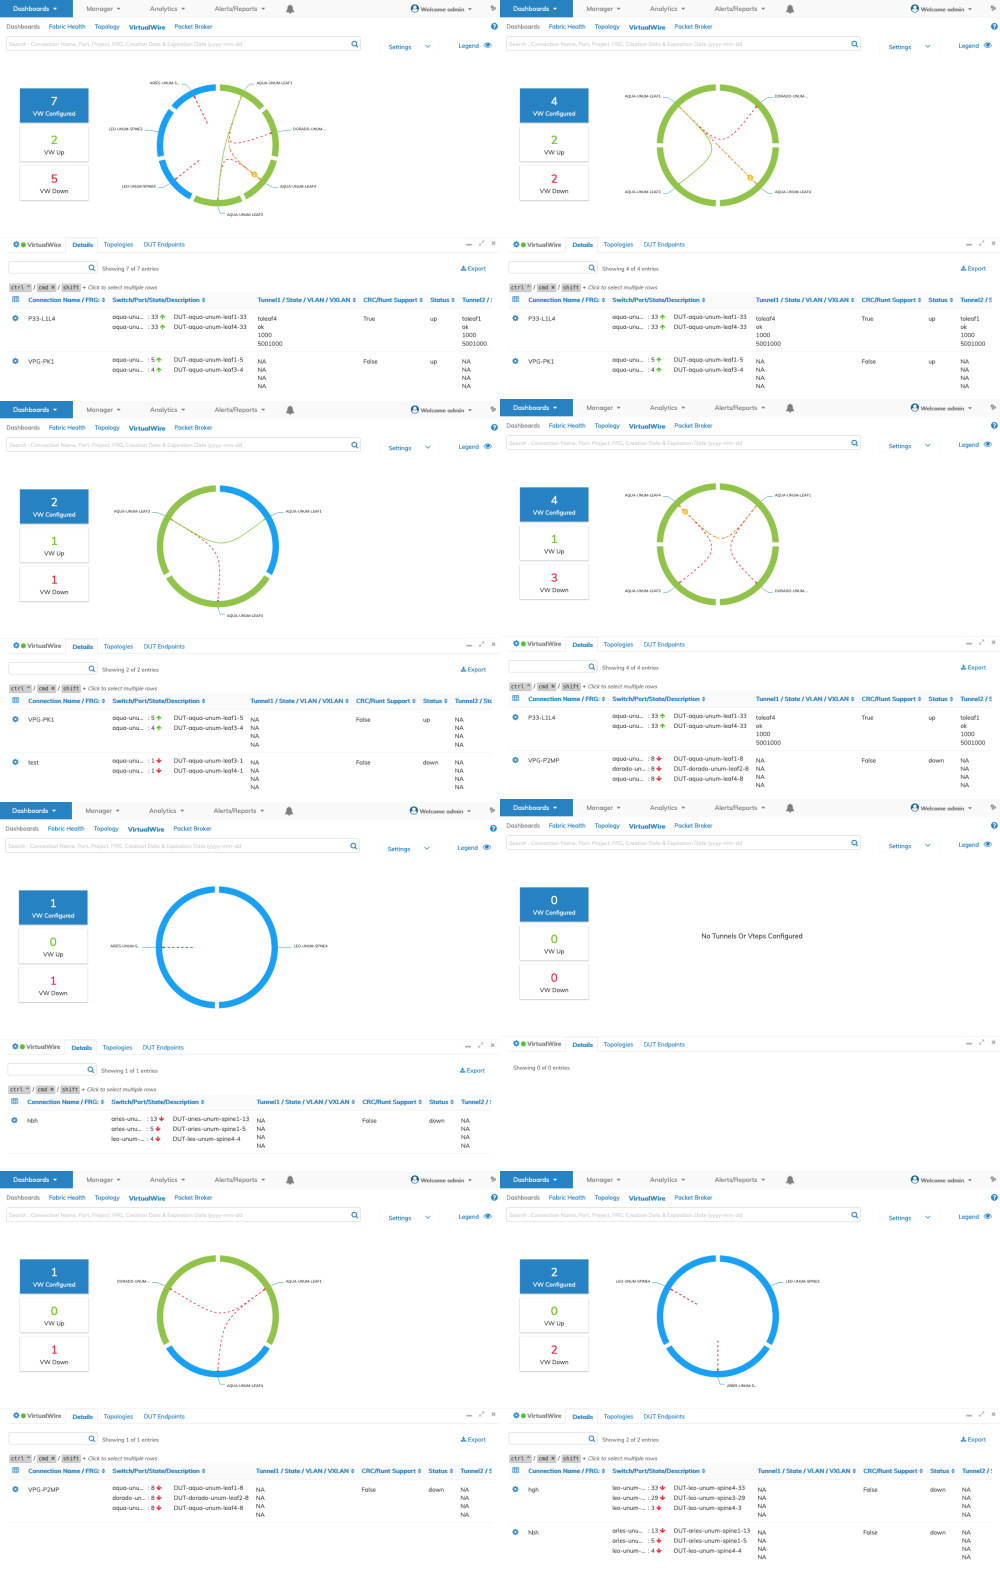
Dashboards VirtualWire Individual Switch and Connection Montage
Discovery Details VirtualWire
Using the Topology dashboard, click on the Status column to display discovery details for the selected switch. VirtualWire-related details include VW Topologies, VPGs, and VLEs.
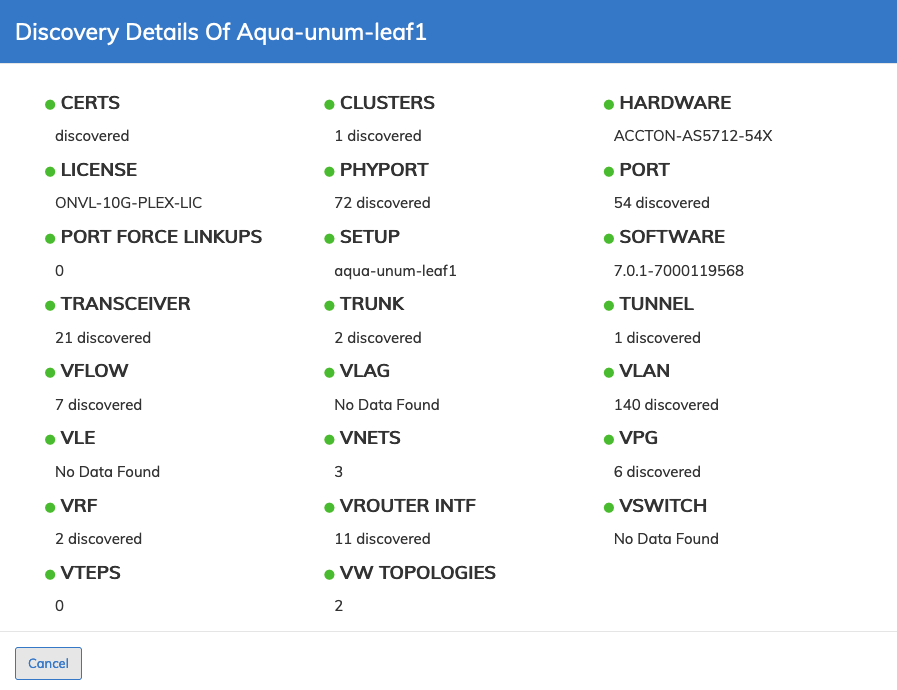
Dashboards VirtualWire Specific Switch Discovery Details